# Our first line of code:
print("Hello World!")
[1] "Hello World!"![]()
Please go to this website and download and install R and RStudio. While R is is a language and environment for statistical computing and graphics, RStudio is the most used integrated development environment for R, facilitating working with it.
In case you don’t use a notebook where you can install R and RStudio, or you don’t want to, you can use the posit Cloud service. It can be run in you browser, and provides the same functions and interface as if you were working with your own RStudio installation. And it’s free as well!
Sign Up to create an account (it’s free) and login.New Project. This will create a new RStudio project, which you can use to follow this workshop the same way as if you had installed R on your notebook.Keep in mind that the free posit Cloud account only gives you 25 computing hours per month, but this should be more than enough for this workshop. Take a look here for the subscription plans.
When you open RStudio it will look something like this:
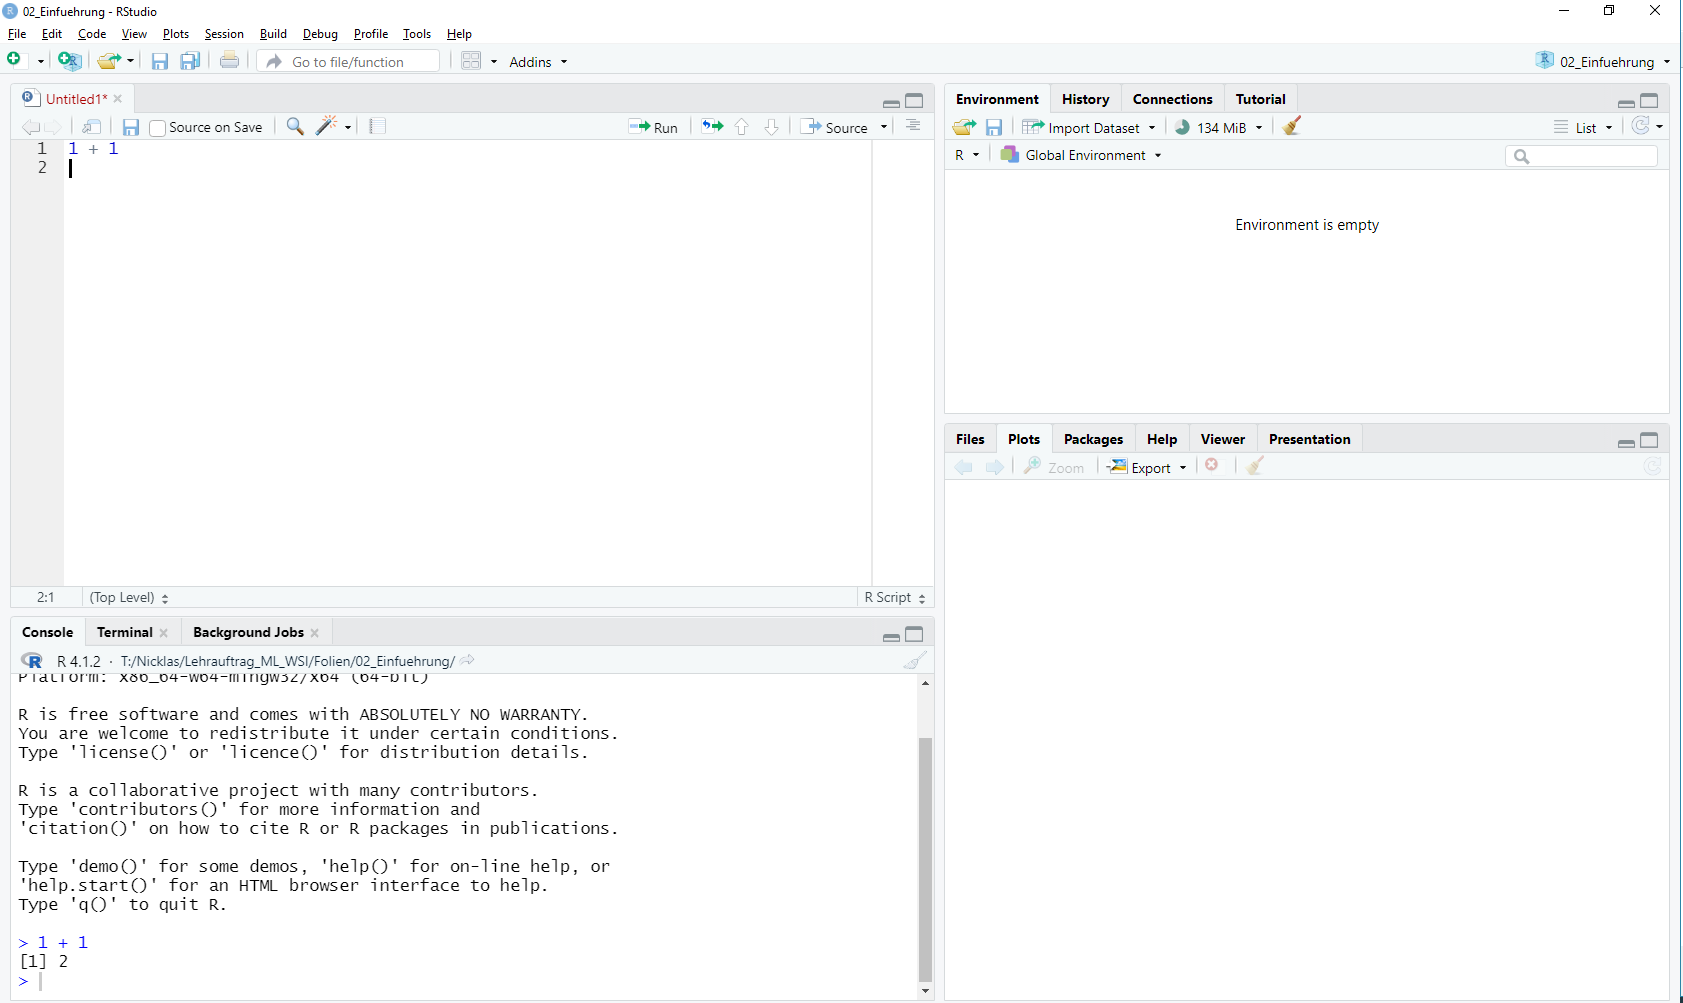
The window can be split into 4 parts:
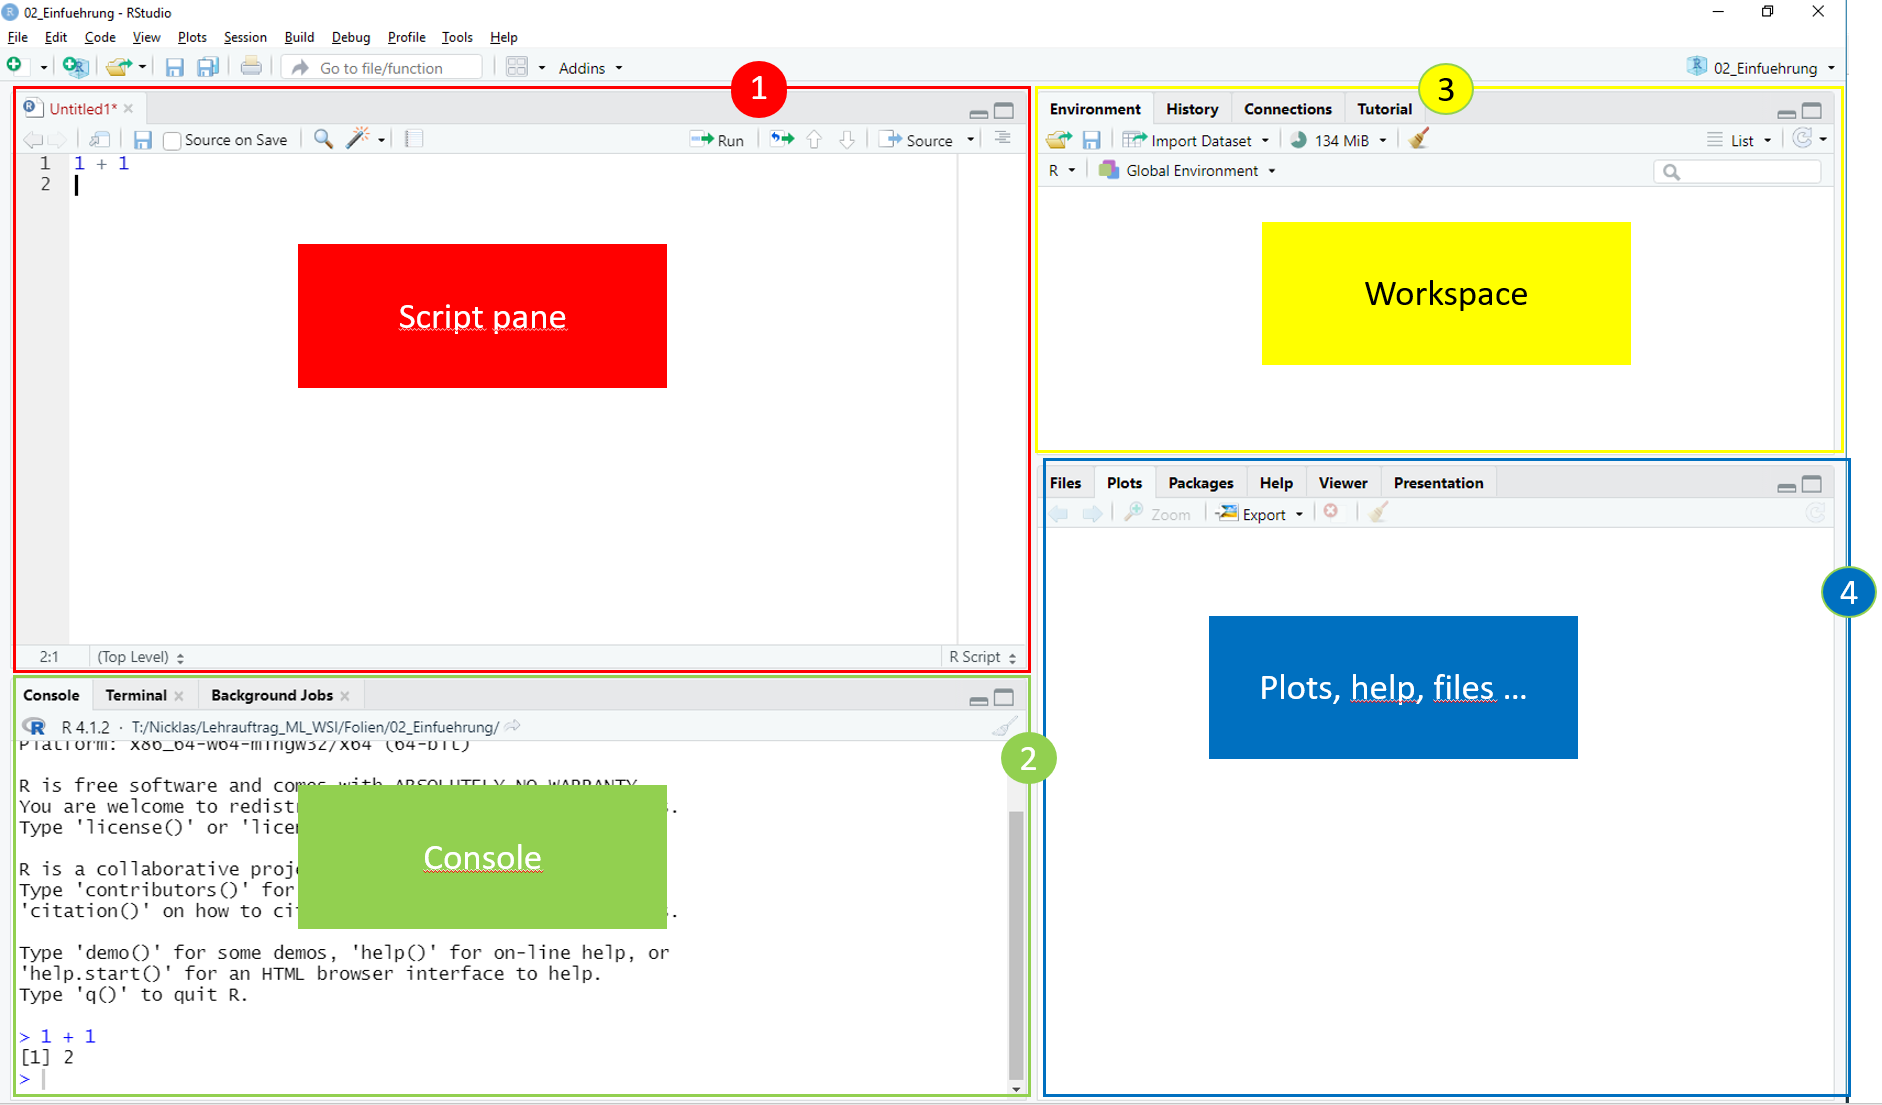
The script pane is used to edit scripts. Scripts are the files you store your code in. You can execute a line of code by pressing ctrl + enter (on windows) or command + return (on macOS). To execute multiple lines of code at once, mark them before you press the keys. Try it yourself! Write:
# Our first line of code:
print("Hello World!")[1] "Hello World!"into your script and execute it. It should output “Hello World!” into your console.
By the way: Code lines that are preceded by a # are commented out, and will not be evaluated.
You can also work directly in the console. Type into your console and then just press enter:
# Sum two values
10 + 5
[1] 15Just beware that the code you write here will not be saved, so it is more usefull for trying out things or for code you don’t need to save in a script.
In the Environment tab you get an overview of the objects currently loaded into your R session. You can also look at your command history and some more things we don’t need for now.
Plots you build in your R session get output in the Plot tab. If you call the help function the documentation opens in the Help tab. The Files tab let’s you mange the files in your working directory.