Starting our analysis project
The purpose of this tutorial is to teach you version control. In order to do this, however, we’ll need to make up a simple project that needs controlling!
Our initial project will be extremely simple – a very small data file and a script that loads and plots it. Later, we’ll add code to fit a nonlinear curve to it.
Download this data to your project folder: Example data (right click to open in a new window and use your Web browser’s save as functionality (likely another right click on the page)). You may need to manually add the file extension “.csv”).
Create a new R script in RStudio. File -> New File -> R script
Enter the following commands into your new R script
mydata = read.csv("example_data.csv")
plot(mydata$xdata,mydata$ydata)
Save the R script as myscript.R. When you run it, it should load and plot the data.
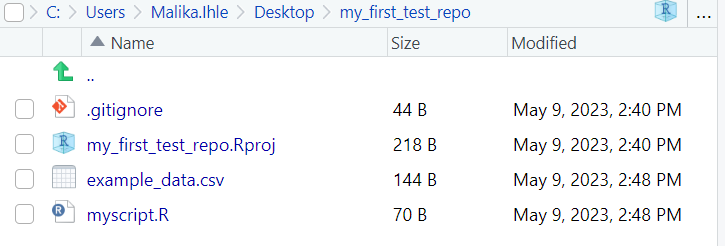
Your directory should now contain 4 files: