Using simulations to check alpha
In most quantitative sciences, we accept a type I error rate of 0.05, which is often called \(\alpha\) or significance level. This value tells us the probability of rejecting the null hypothesis (i.e., of assuming an effect) given that the null hypothesis is true.
In other words, if there is no true effect (e.g., no difference between two groups), we would expect our null hypothesis of no effect to be incorrectly rejected (\(\alpha\) * 100)% of the time.
If you draw from the same normal distribution twice, there is no difference in their population means. Can we reproduce in our simulations that the means of the two samples differ significantly in 5% of the cases?
YOUR TURN:
1. Figure out how to do a t-test in R.
2. Generate two vectors of 10 values drawn from \(N(0,1)\) and compare them with a t-test.
3. Figure out how to extract the p-value from that object (explore your R object with the functions str() or names()).
4. Write a function simT() that generates two vectors of n values drawn from a standard normal distribution (N(0,1)), compares them with a t-test, and returns the p-value.
5. Test your function by calling it for n = 50.
6. For a sample size of n = 10, generate nrep = 20 repetitions and draw a histogram.
7. Repeat the previous task with nrep = 100 repetitions.
p-values of t-tests comparing means from 20 or 100 repetitions simulating \(N(0,1)\) with n = 10:
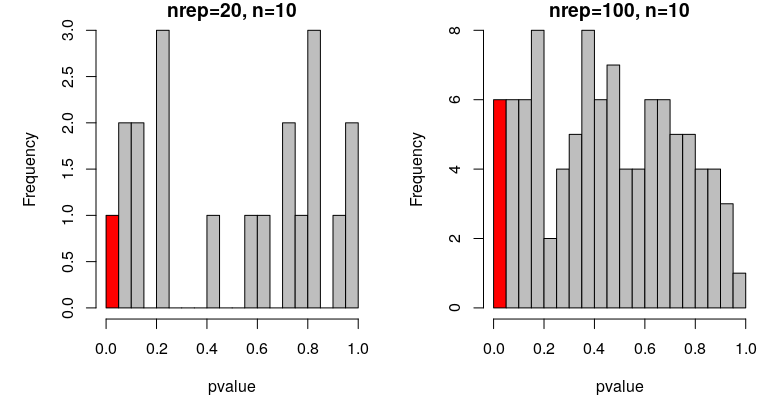
In the first case, where nrep = 20, we expect 1 out of the 20 tests to be significant (5%). With my seed, I did! How many did you get?
In the second case, where nrep = 100, we expect 5 out of the 100 tests to be significant. With my seed, I got 6. How many did you get?
Are those deviations meaningful? Do they significantly differ from the nominal level of 5%?
YOUR TURN:
1. Plot a histogram of nrep = 1000 repetitions of the function simT with n = 10.
2. Plot a histogram of nrep = 1000 repetitions of the function simT with n = 100.
p-values of t-tests comparing means from 1000 repetitions simulating \(N(0,1)\) with n=10 or n=100:
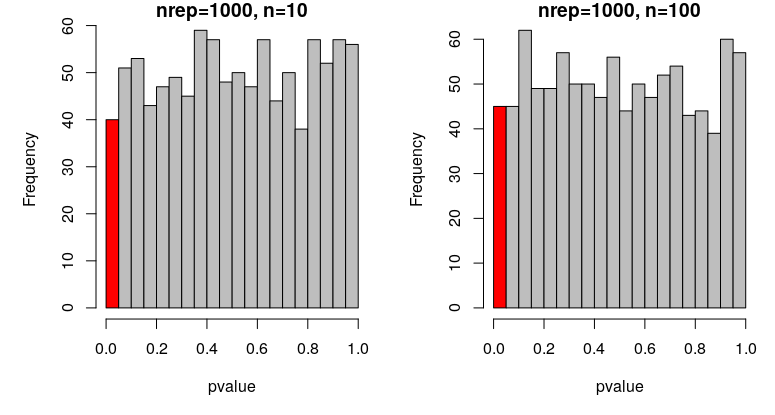
In both cases, we expect 50 out of the 1000 tests to be significant by chance (i.e. with a p-value under 0.05). In my repeated simulations, I get 40 and 45 false positive results for n = 10 and n = 100, respectively. How many did you get?
These proportions are not significantly different from 5%.
prop.test(45, 1000, p = 0.05, alternative = "two.sided", correct = TRUE)1-sample proportions test with continuity correction
data: 45 out of 1000, null probability 0.05
X-squared = 0.42632, df = 1, p-value = 0.5138
It is important to note that, although alpha = 0.05 is commonly used, this is an arbitrary choice and you should consider what is an appropriate type 1 error rate for your particular investigation.
Although it isn’t necessary to check that a statistical analysis as simple as a t-test does not yield more than 5% false-positive results, in situations where the structure of the data is complex and analysed with more advanced models (e.g., when explanatory variables are mathematically linked to each other, are combined in a mixed-effect model, or your data deviates from assumptions of the statistical model), this may allow to compare different modelling approaches and select one that does not produce more than 5% false-positive results.
Such a complex example, where simulation is the only viable approach to construct a statistical model that does not lead to spurious effects, can be found in this paper:
- Ihle, M., Pick, J. L., Winney, I. S., Nakagawa, S., & Burke, T. (2019). Measuring Up to Reality: Null Models and Analysis Simulations to Study Parental Coordination Over Provisioning Offspring. Frontiers in Ecology and Evolution, 7, 142. https://doi.org/10.3389/fevo.2019.00142
Back to top