About credible and open research

Malika Ihle & Sarah von Grebmer

16/08/2026

Licence

This work was originally created by Malika Ihle and subsequently adapted by Sarah von Grebmer zu Wolfsthurn and Malika Ihle. This current work licensed under a CC-BY-SA 4.0 Creative Commons Attribution 4.0 International SA License. It permits unrestricted re-use, distribution, and reproduction in any medium, provided the original work is properly cited. If you remix, transform, or build upon the material, you must distribute your contributions under the same license as the original.

Contribution statement

Creator: Ihle, Malika (orcid logo 0000-0002-3242-5981)

Reviewer: Von Grebmer zu Wolfsthurn, Sarah (orcid logo 0000-0002-6413-3895)

Consultant: Schönbrodt, Felix (orcid logo0000-0002-8282-3910)

Prerequisites - EDIT

Important

Before completing this submodule, please carefully read about the prerequisites.

Prerequisite Description Link/Where to find it
UNESCO Recommendations on Open Science Recommended reading: pp 6-19 Download Link
Introduction to the reproducibility and replicability Basic familiarity with current challenges in research and the effects on research quality ADD Link to slide deck

Questions from the previous session?

Quiz!

QR code here

Refreshing our memories…

What is replicability?

  1. Obtaining consistent results when the same data and methods are used again

  2. Obtaining statistically significant results when repeating an analysis

  3. Obtaining consistent results when a study is conducted again using new data and following the same methods

  4. Reanalyzing the original data using a different statistical method

What is reproducibility?

  1. Obtaining statistically significant results when repeating an analysis

  2. Collecting new data to test whether an original finding generalizes to a different population

  3. Using multiple statistical methods to determine which produces the strongest result

  4. Obtaining consistent results when the same data and methods are used again

What is HARK-ing?

  1. Changing your statistical analysis plan before collecting data and preregistering the new plan

  2. Presenting a hypothesis developed after seeing the data as if it had been predicted before the study

  3. Repeating an analysis using a different statistical software package to check its accuracy

  4. Reporting both significant and non-significant results in a research paper

What is p-hacking?

  1. Changing a hypothesis after seeing the results and presenting it as if it were predicted beforehand

  2. Registering multiple hypotheses before collecting data to reduce the risk of false positives

  3. Repeating an analysis using a different statistical method to assess the robustness of a finding

  4. Using flexibility in data collection, analysis, or reporting to find and report statistically significant results

Reminder: (Idealized) Research life cycle
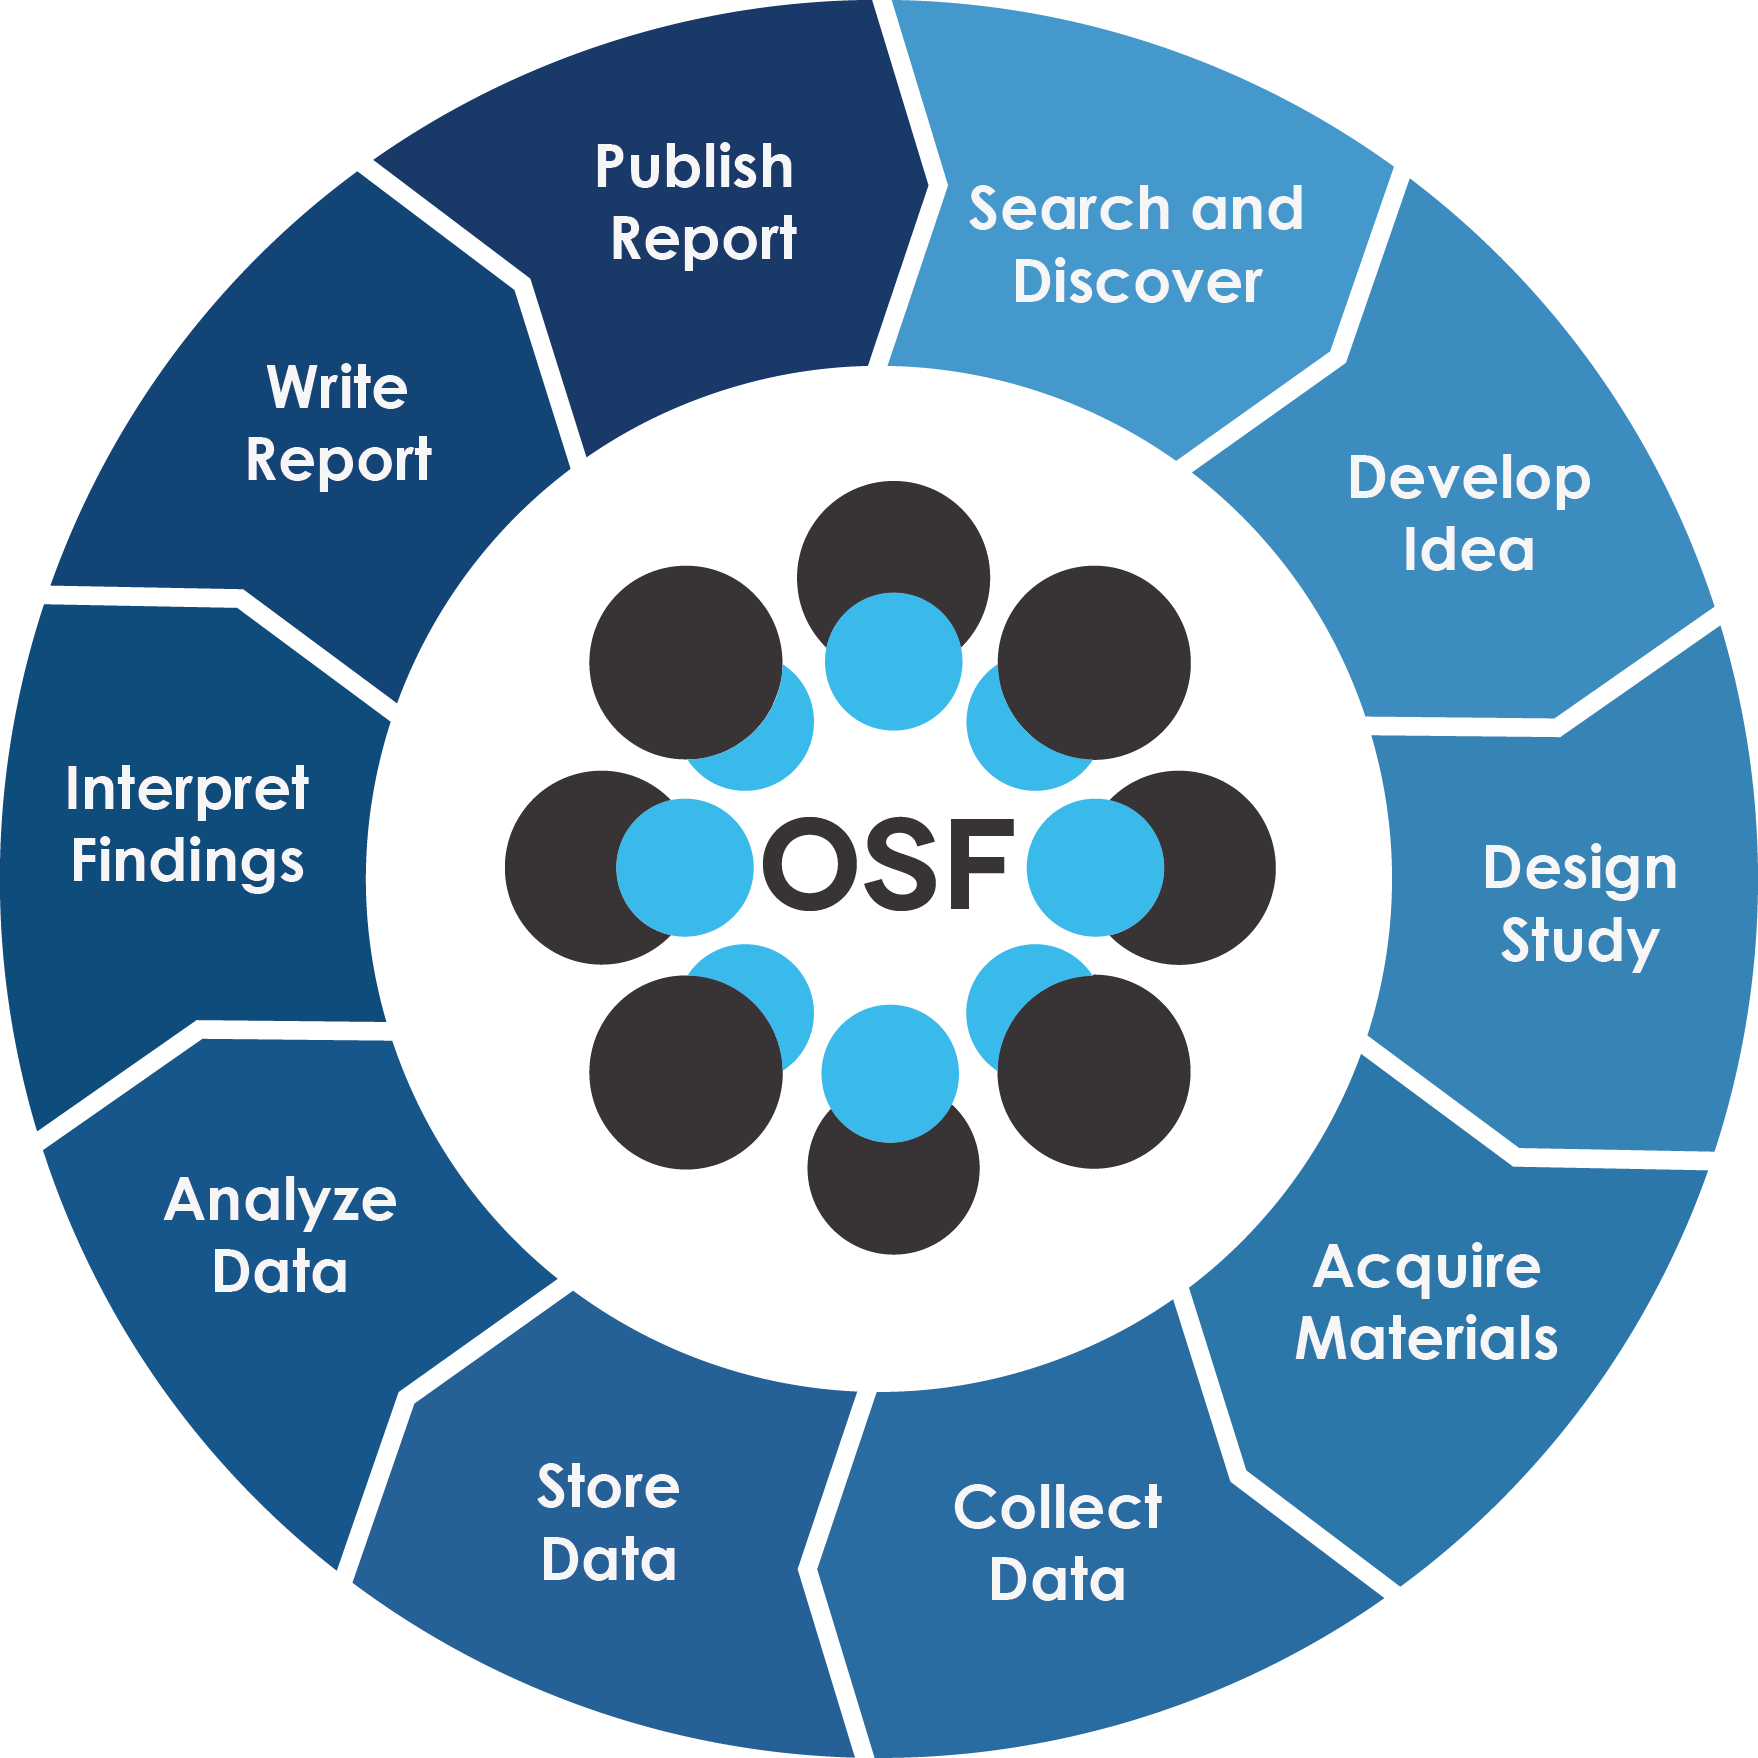
Figure by the Center for Open Science depciting the traditional research cycle

Before we start: Survey time!

QR Code here

Remember: There are no correct answers!

Which research methodologies do you use in your research? (Select all that apply)

  1. Quantitative or experimental methods

  2. Observational methods

  3. Qualitative methods

  4. Theoretical methods

  5. Mixed qualitative and quantitative methods

  6. None of the above

Which of the following Open Science practices have you already heard of? (Select all that apply)

  1. Preregistration

  2. Registered reports

  3. Simulation methods for power analysis

  4. Computational reproducibility (e.g., code documentation, RStudio projects, version control …)

  5. None of the above

Which of the following concepts or skills do you feel most confident about in relation to computational reproducibility? (Select all that apply)

  1. Creating and using RStudio projects

  2. Using a standardized folder structure for your projects

  3. Automatizing workflows through different scripts for different processing steps

  4. Commenting my code

  5. Using Quarto to combine code, text, figures etc. in one location

  6. Version control with Git

  7. None of the above

Discussion of survey results

What do we see in the results?

Covered in this session

  • Introduction to the framework of Open Research: Values, principles, pillars, integration into the research life cycle
  • Increasing reliability of our work: preregistration, registered reports, data simulation and power analysis
  • Increasing reproducibility of our work: computational reproducibility, including data sharing, portable projects, automated workflows, dynamic reports and version control

Learning goals

After this session, learners will be able to:

  • Explain how common research practices and biases, such as p-hacking, HARKing, and researcher degrees of freedom, can threaten the credibility and replicability of research

  • Define key concepts related to credible and open research, including Open Research, preregistration, registered reports, FAIR data, and computational reproducibility.

  • Describe how open research practices, such as preregistration, registered reports, simulations, data sharing, and reproducible workflows, can help address threats to research credibility.

  • Identify key components of a computationally reproducible workflow, including data, code and documentation, and the computational environment, and matching them to appropriate practices and tools.

Key terms and definitions - EDIT

  • Open Research: Definition
  • Preregistration: Definition
  • Registered report: Definition
  • Data simulation: Definition
  • Computational reproducibility: Definition
  • Literate programming: Definition
  • Version control: Definition

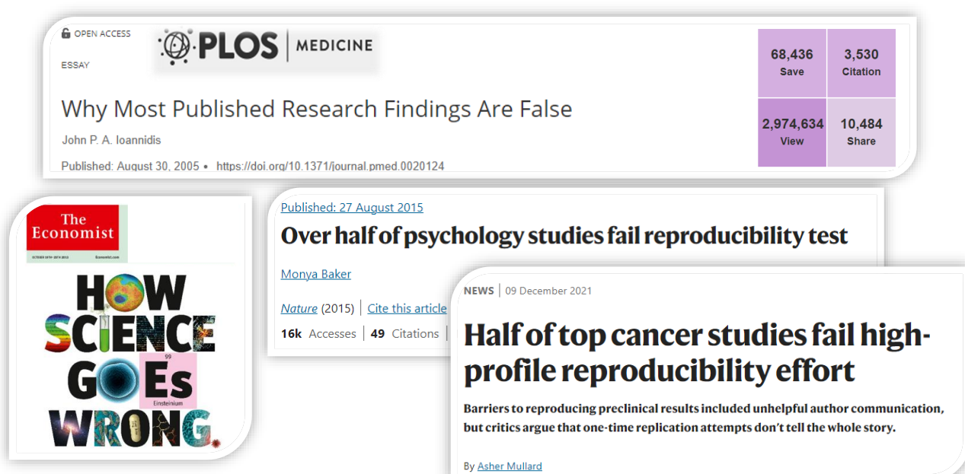
Remember the replicability crisis?

articles discussing the reproducibility crisis

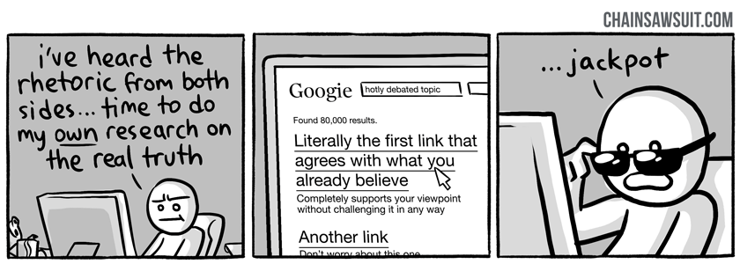
Threats to reliable research: Biases

Remember these..?
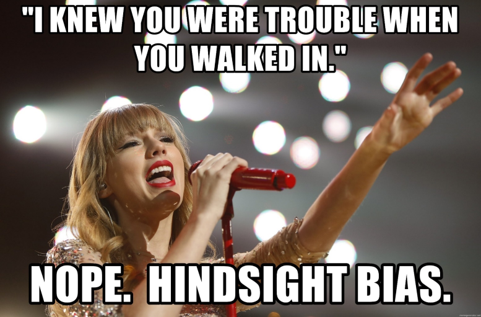
ADD

ADD

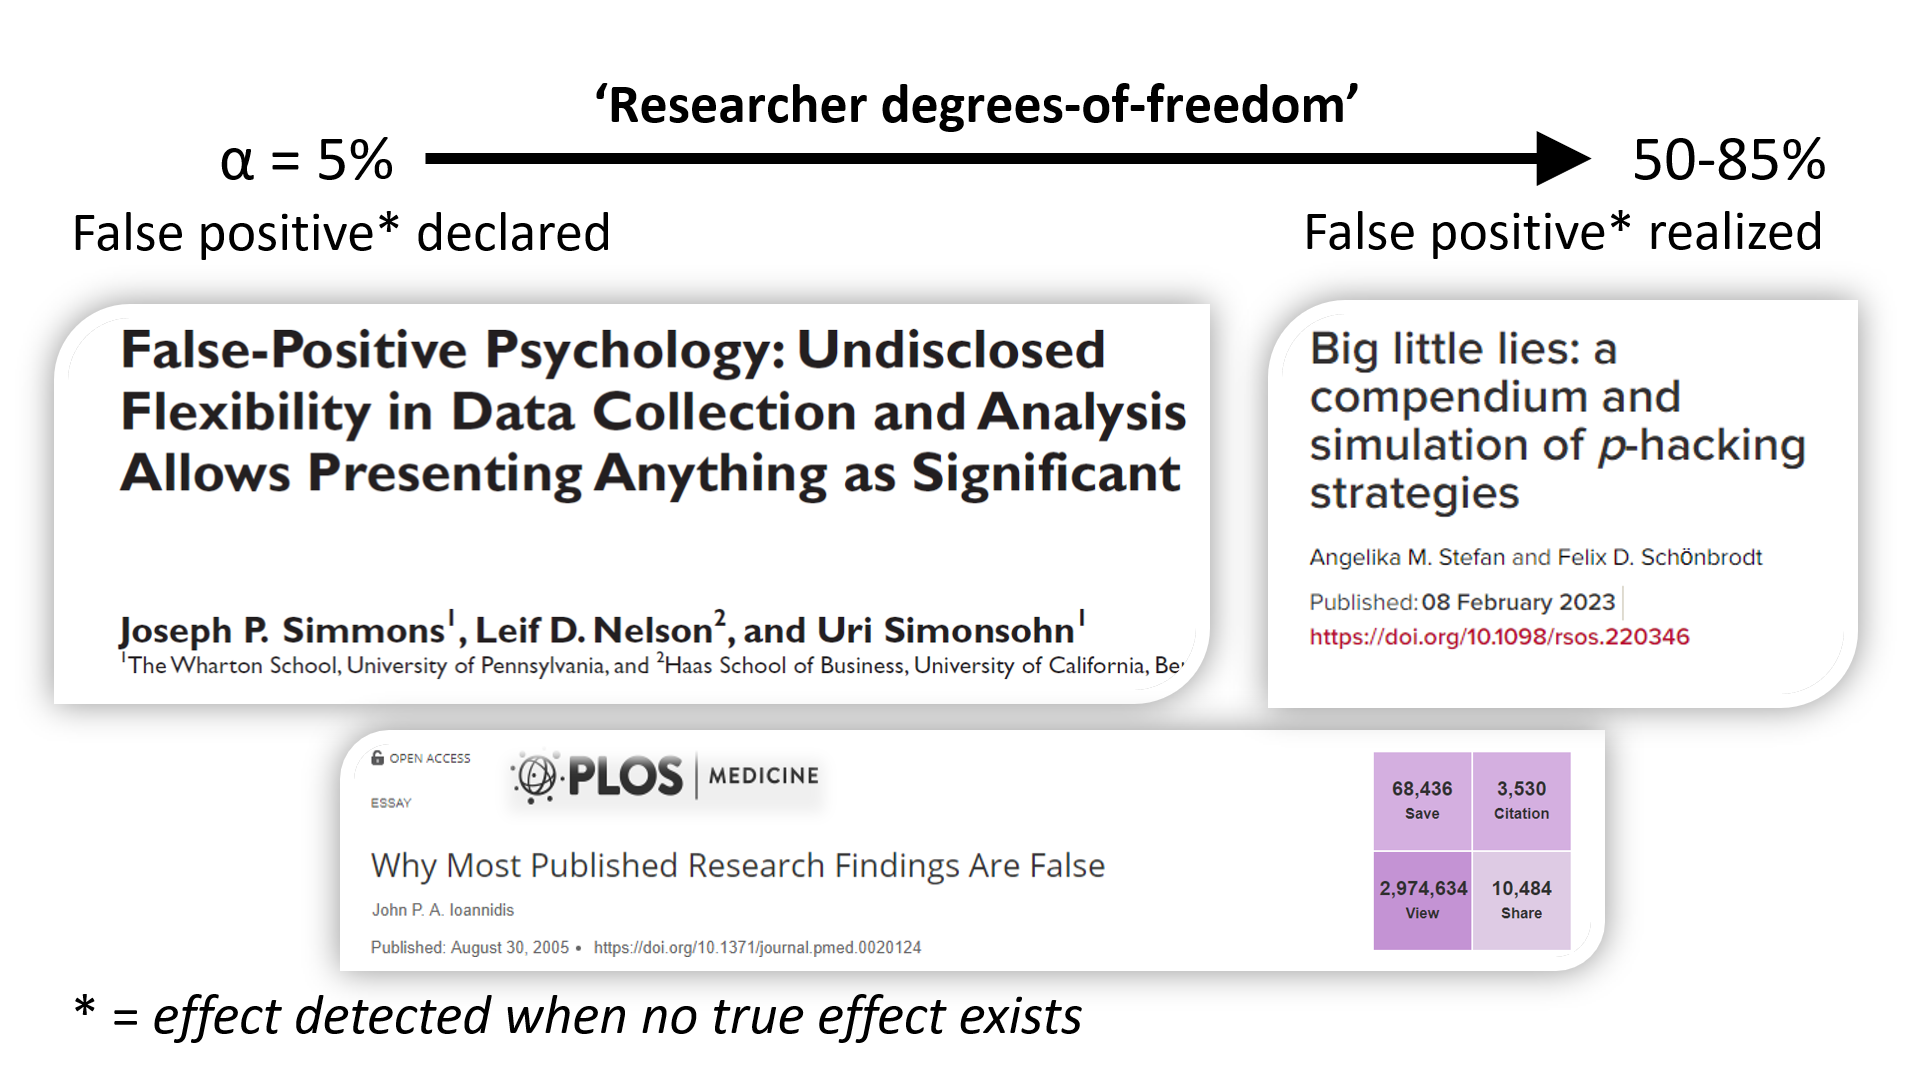
Threats to reliable research:
p-hacking
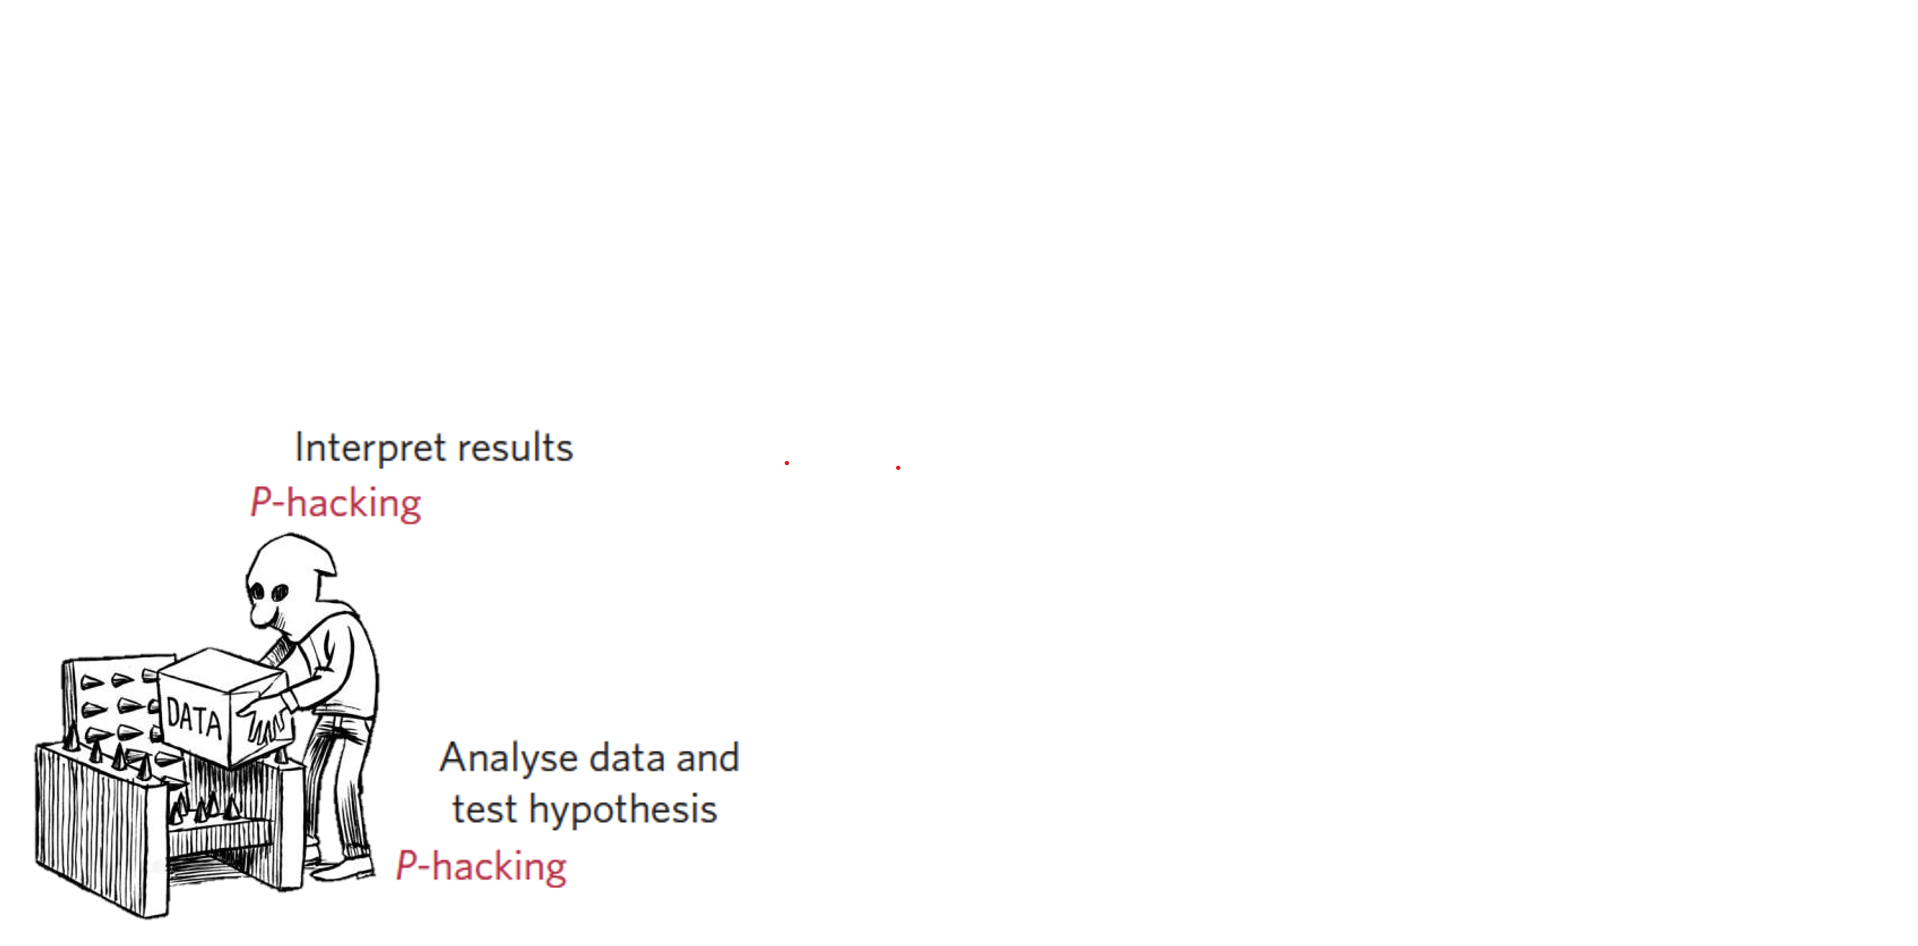
ADD

Threats to reliable research: HARK-ing
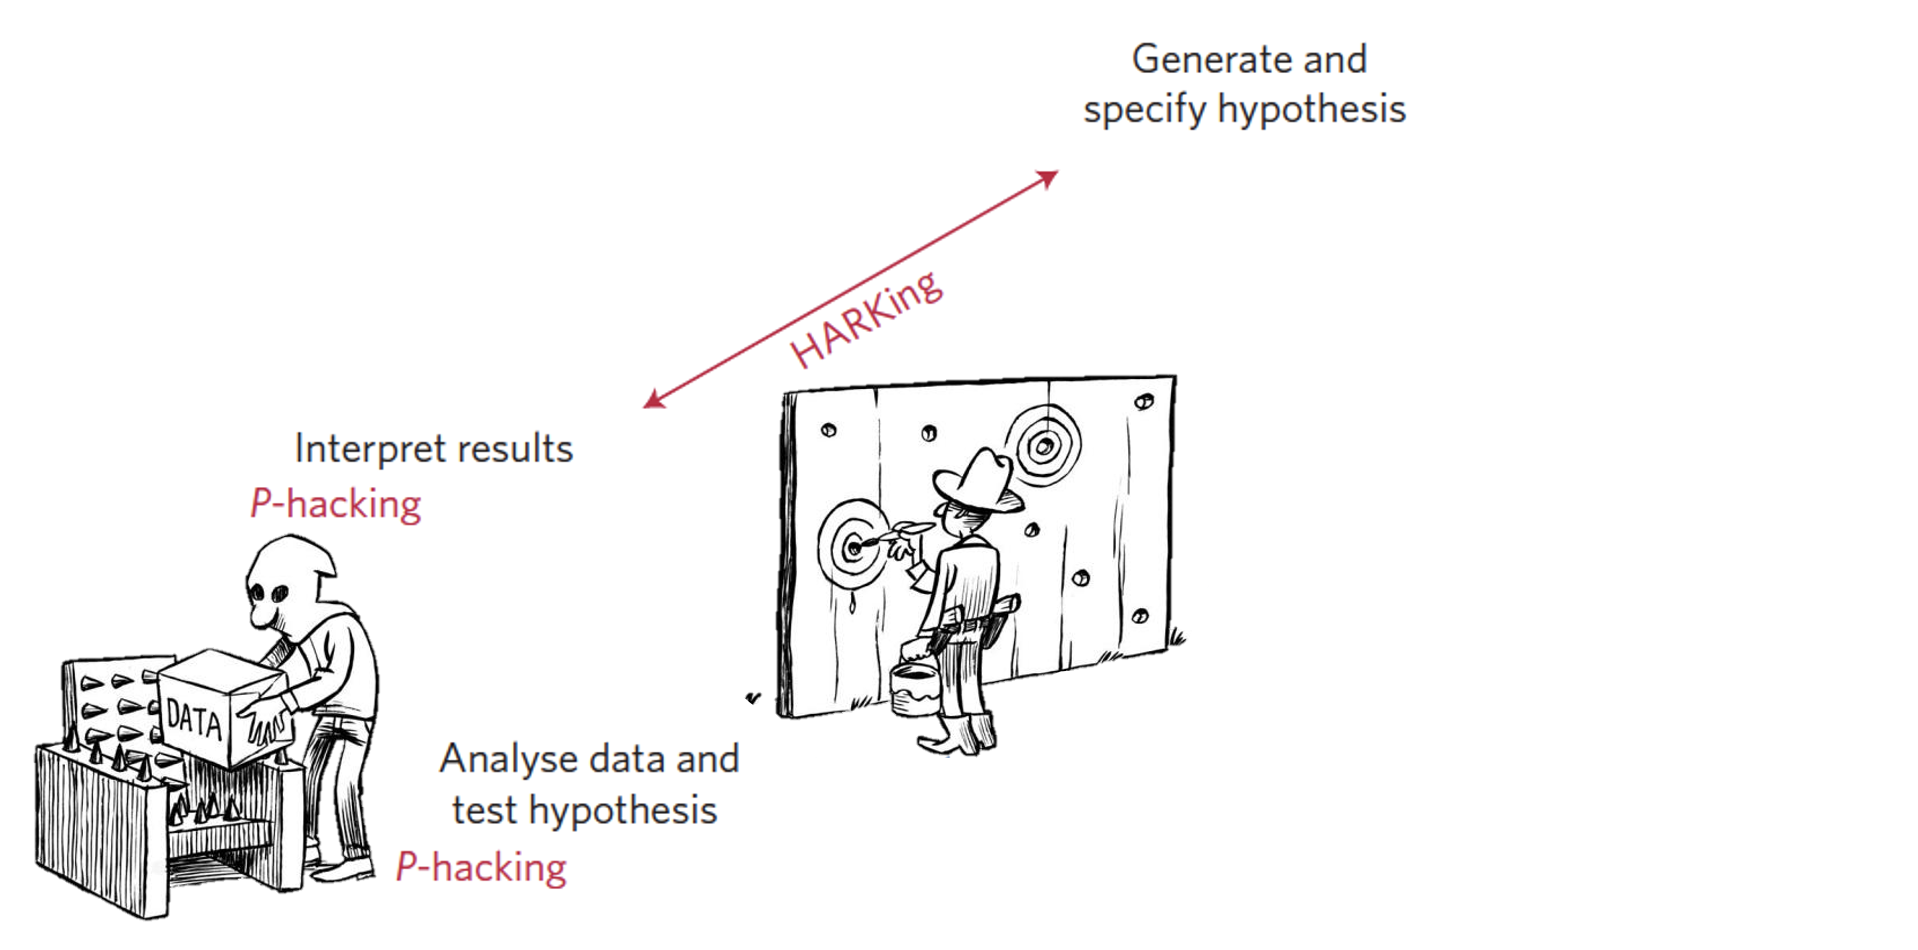
ADD

Threats to reliable research:
Big picture
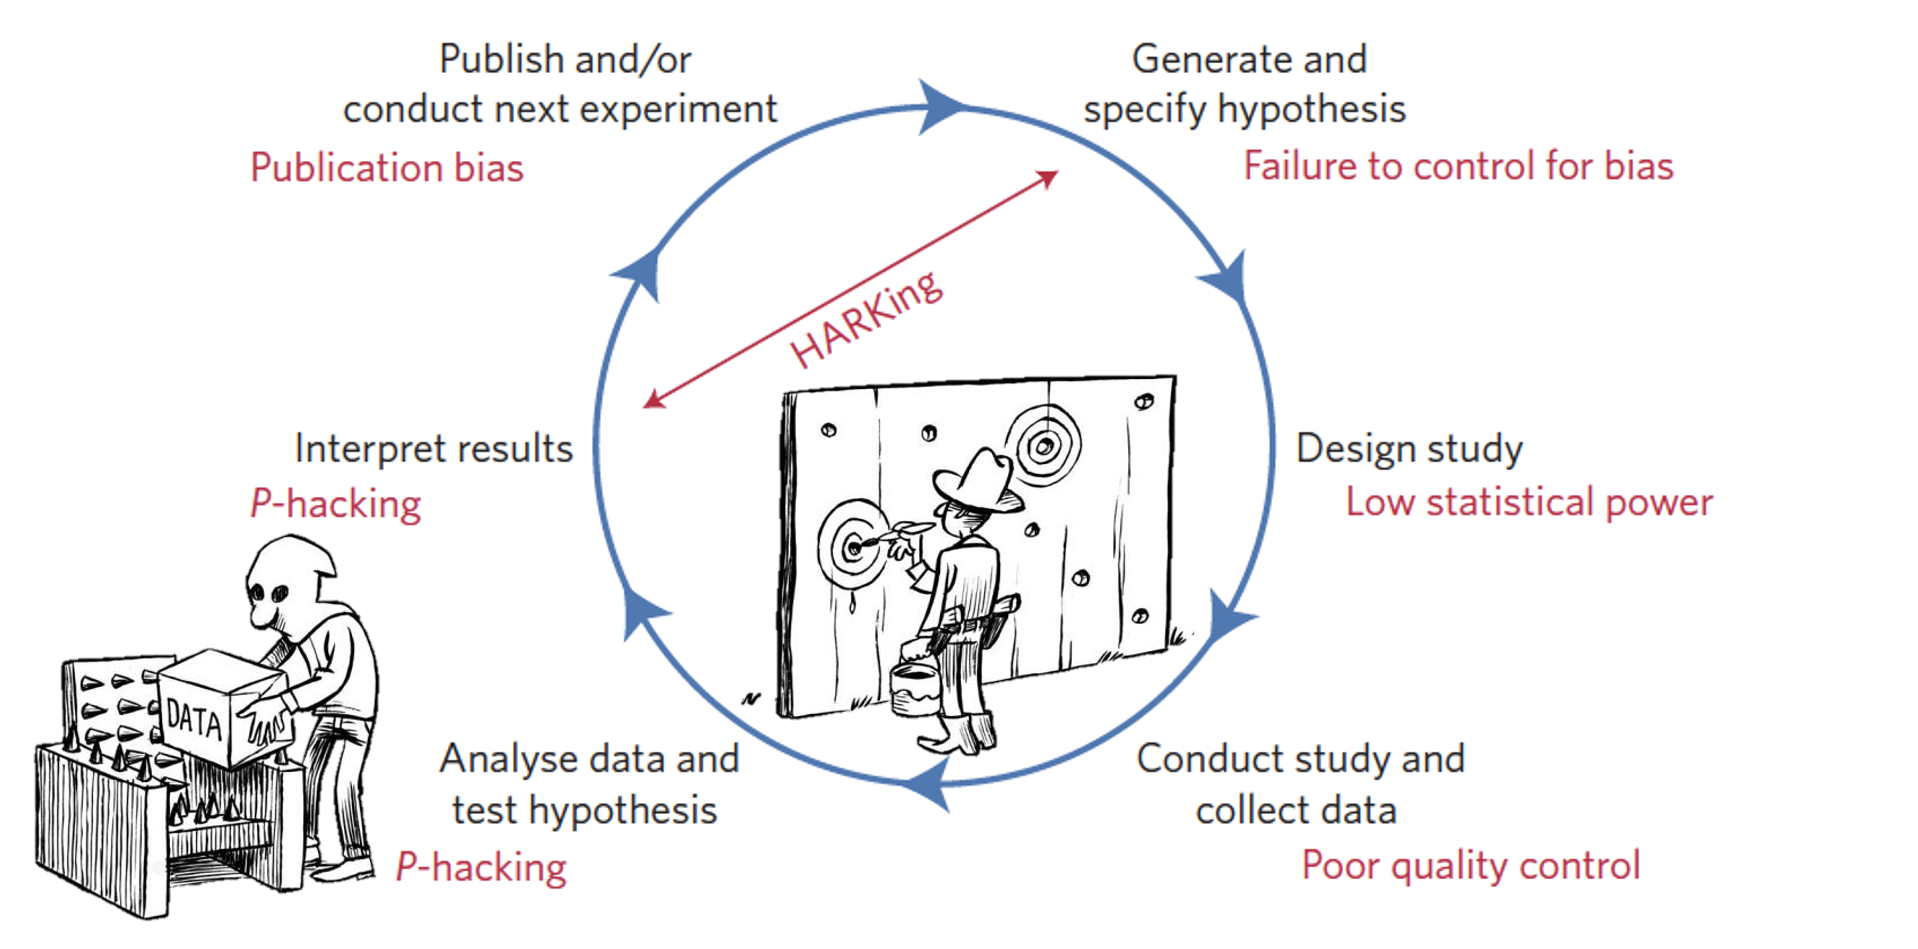
ADD

The effects of unrealiable research

crossroads

Researcher degrees of freedom

Possible researcher “decisions” could be:

  • Increasing our sample size N after failure
  • Removing outliers after seeing their effect
  • Post-hoc categorizing or transforming predictors
  • Removing a treatment category
  • Adding baseline measures as covariate
  • Controlling for covariates or interaction terms

A new way of doing research


Open Research
a.k.a.
A scientific framework for the 21. century

Your turn: 6 minutes

Think (2 min)

  • For yourself: Write down what you associate with the term Open Research


Pair (2 min)

  • Discuss your thoughts with your neighbor.


Share (2 min)

  • Share your thoughts with the larger group.


(without internet search - your current understanding)

Introducing Open Research

UNESCO defines it as:

“[…] open science is defined as an inclusive construct that combines various movements and practices aiming to make multilingual scientific knowledge openly available, accessible and reusable for everyone, to increase scientific collaborations and sharing of information for the benefits of science and society, and to open the processes of scientific knowledge creation, evaluation and communication to societal actors beyond the traditional scientific community.”
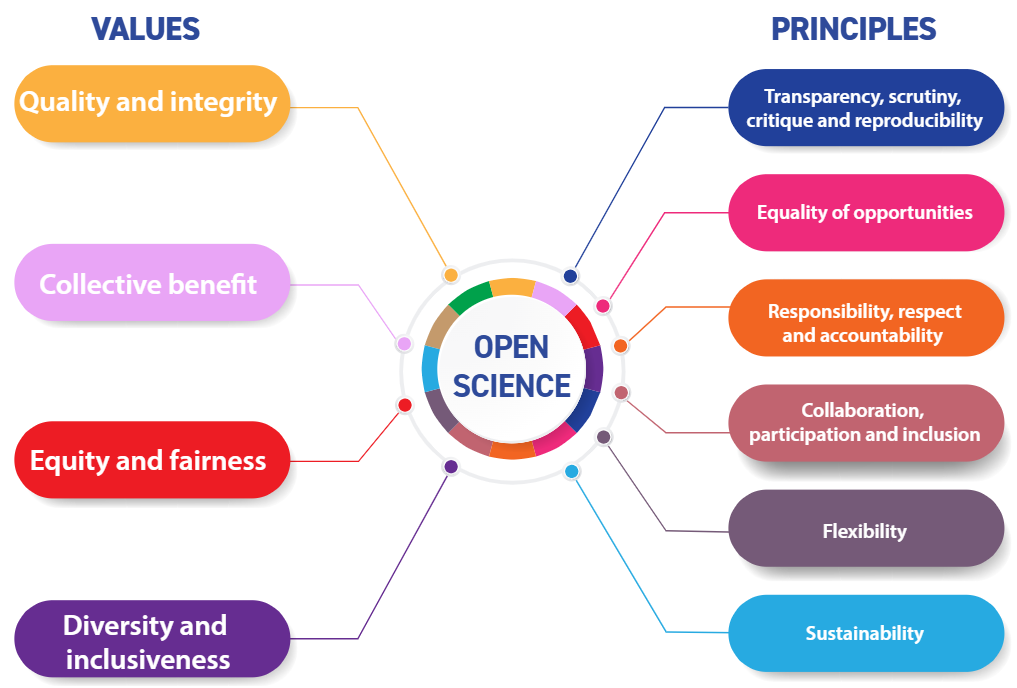

Figure from the UNESCO Recommendations on Open Science depicting the guiding values and principles of Open Science

Figure from CyVerse 2025 depicting the six pillars of Open Science: open access publications, open data, open educational resources, open methodology, open peer review, and open source software

Note

These pillars are not set in stone, different frameworks and disciplines identify different pillars.

Introducing Open Research: Tools and integration
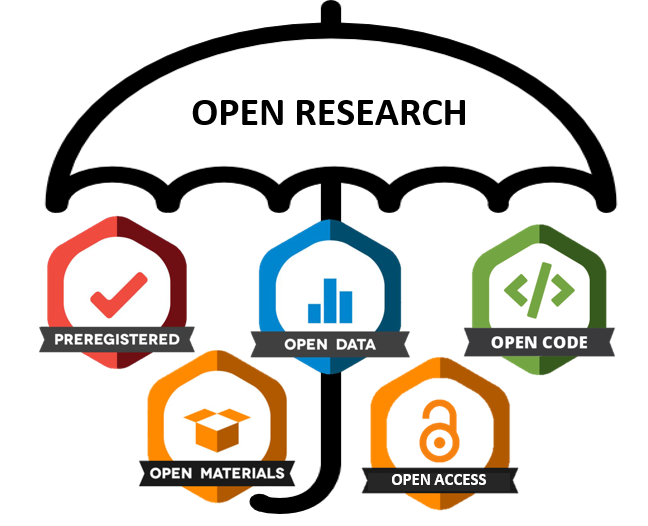
Figure depicting the umbrella term Open Research and connected research practices

Adapted from Danielle Robinson and Robin Champieux (Robinson, 2018) https://osaos.codeforscience.org/what-is-open/. Badges from the Center for Open Science.
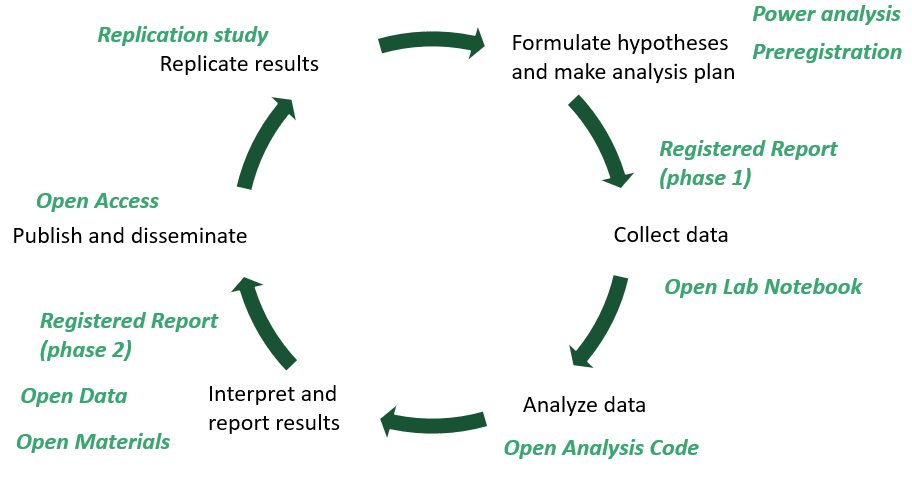
Our path to replicability

ADD

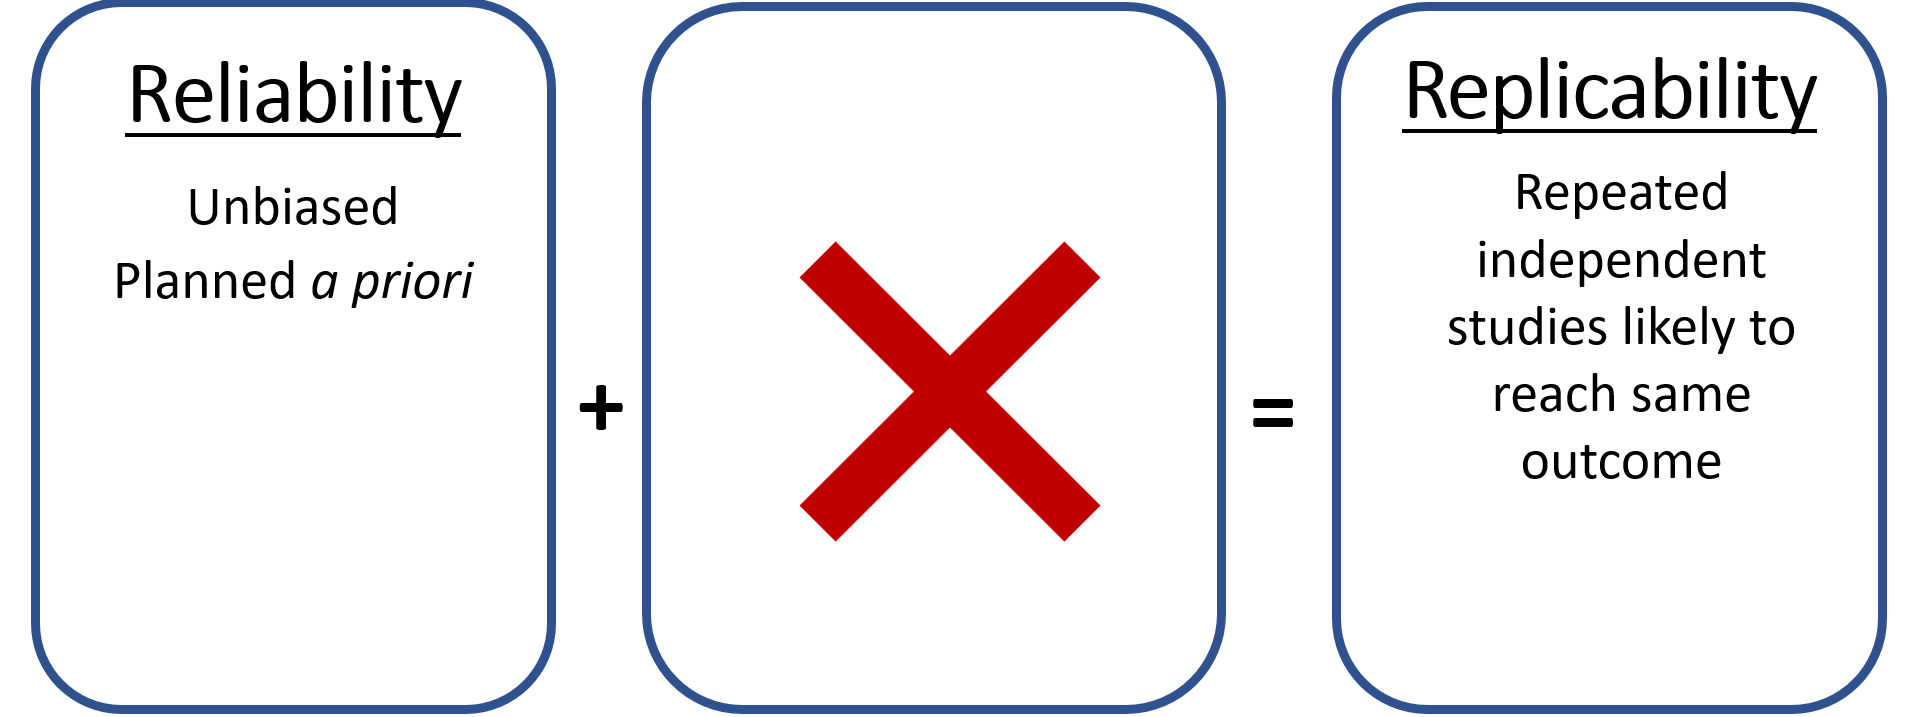
Reliability

ADD

1. Preregistration


Preregistration badge from the Center for Open Science

= specifying your research plan in advance of your study and submitting it to a registry”.

Where to preregister?


Resources for preregistration including aspredicted.com, Center for Open Science, Animal Study Registry, ClinicalTrials.gov and PreclinicalTrials.eu

Decisions process (I)

Decisions needed

  • Choosing dependent variable
  • Choosing sample size
  • Choosing covariate
  • Variable transformation
  • Data exclusion criteria
  • How to deal with missing data
  • What to report

Post-hoc decision rules

  • Confirmation bias
  • Hindsight bias
  • Direction of effect that obviously makes sense

= p-hacking

Decisions process (II)

Decisions needed

  • Choosing dependent variable
  • Choosing sample size
  • Choosing covariate
  • Variable transformation
  • Data exclusion criteria
  • How to deal with missing data
  • What to report

Post-hoc decision rules

  • Biological relevance
  • e.g. Power analysis
  • e.g. Collinearity
  • if distribution condition is met
  • if criteria are met
  • Decision rule (average/exclude)
  • All!

A prior hypothesis testing and exploratory analyses

  • Exploratory analyses are still allowed!
    • But: have higher false positive rates (> 5%) compared to a prior hypothesis testing (= 5%)
    • Can motivate future work
  • Need to be clearly distinguishable from a priory hypotheses testing!

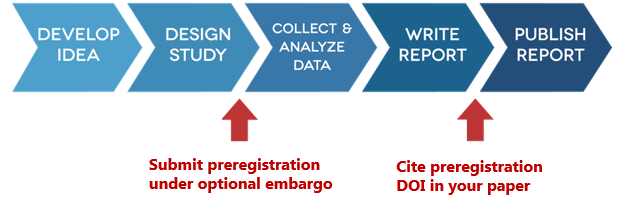
Preregistration submission process


ADD

2. Registered reports


Logo of the Center for Open Science

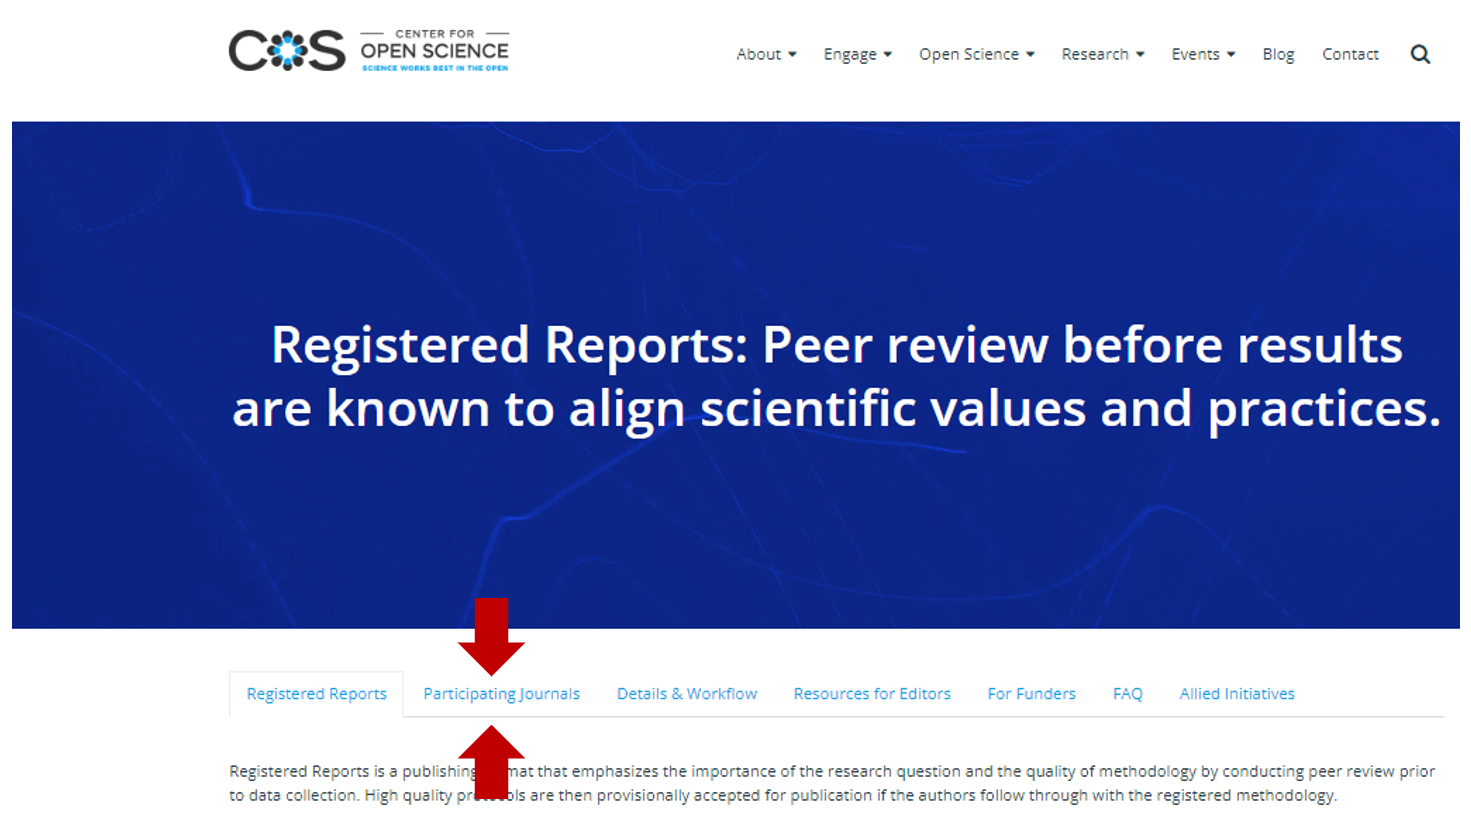
= “a publishing format that emphasizes the importance of the research question and the quality of methodology by conducting peer review prior to data collection.”

Registered report submission process
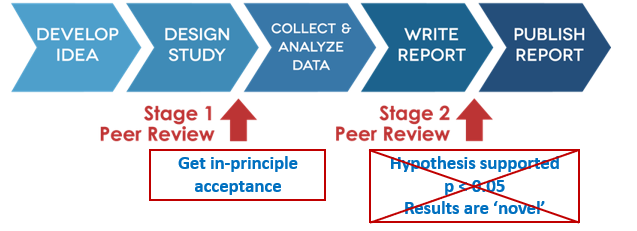

ADD

Acceptance of registered reports

ADD

3. Simulations and power analysis

How to know whether your planned statistical test is appropriate?

  1. Simulate random data (anticipating distribution of variables and sample size)
  2. Run statistical test and save parameter of interest
  3. Replicate
  4. Check that results are random (significant in only 5% of the case)
  5. Generate data including an effect (e.g. imposing a correlation between two variables)
  6. Check that your model is picking up the effect simulated, in 80% of the cases (power analysis)

Pre-break quiz

QR code here

What is a preregistration?

  1. A report of the study results that is submitted after data collection

  2. A time-stamped record of a study’s research questions, hypotheses, methods, and/or analysis plans made before the research is conducted

  3. A requirement to publish all study results regardless of their statistical significance

  4. A method for repeating a study using a new sample

What is a Registered Report?

  1. A preregistration that is kept private until the study is published

  2. A research paper that reports the results of a previously published study

  3. A publishing format in which the study protocol is peer reviewed before data are collected, followed by a second stage of review after the study is completed

  4. A statistical method for determining the required sample size

What is the main purpose of data simulation when planning a study?

  1. To replace the collection of real data with simulated data

  2. To make a study’s results more statistically significant

  3. To generate data that can be reported as if they were collected from real participants

  4. To explore how different assumptions about the data and analysis may affect the study’s results and inform decisions such as sample size and analysis plans

Break! 15 minutes

Post-break discussion


What remains unclear this far? What questions do you have?

Our path to replicability

ADD

Reproducibility

ADD

Click, click, click

The manual workflow
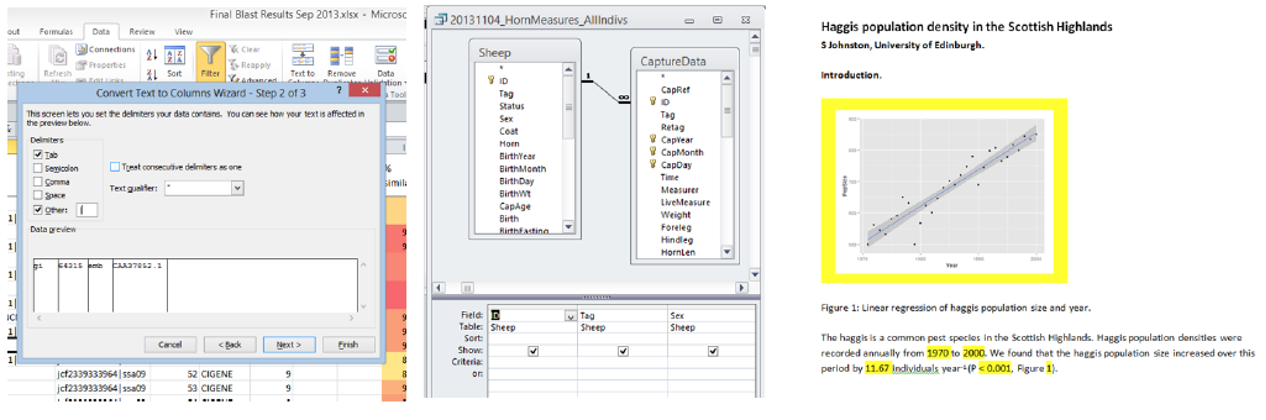
ADD

4. Computational reproducibility

The automated workflow

  • code and scripts for different processing steps, e.g.,
    • load-data.csv
    • clean-data.csv
    • analyze-data.csv
  • -> Reproducible and more efficient when new data, new collaborator, new project

  • -> Possibility to correct errors

ADD

Components of computational reproducibility

ADD

  1. Raw data
    (or anonymized or synthetic dataset)

ADD

  1. Code and documentation
    to reproduce data processing and data analyses
ADD


  1. Specifications
    of your computational
    environment

4a. Raw data (or anonymized or synthetic datasets)

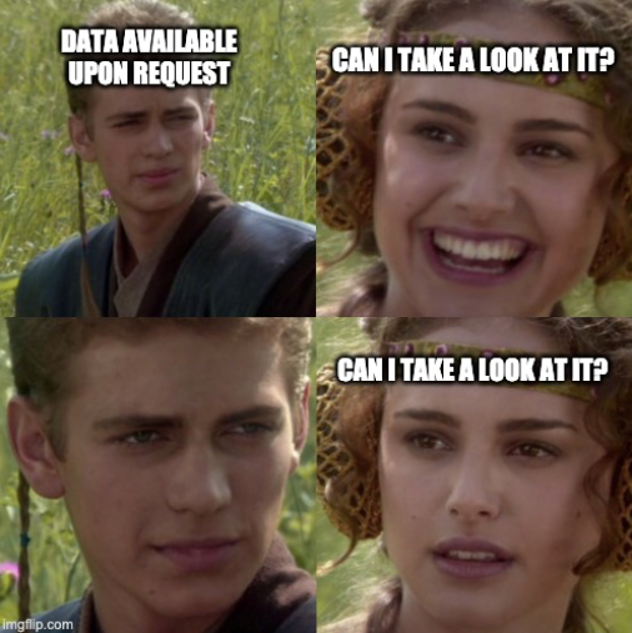
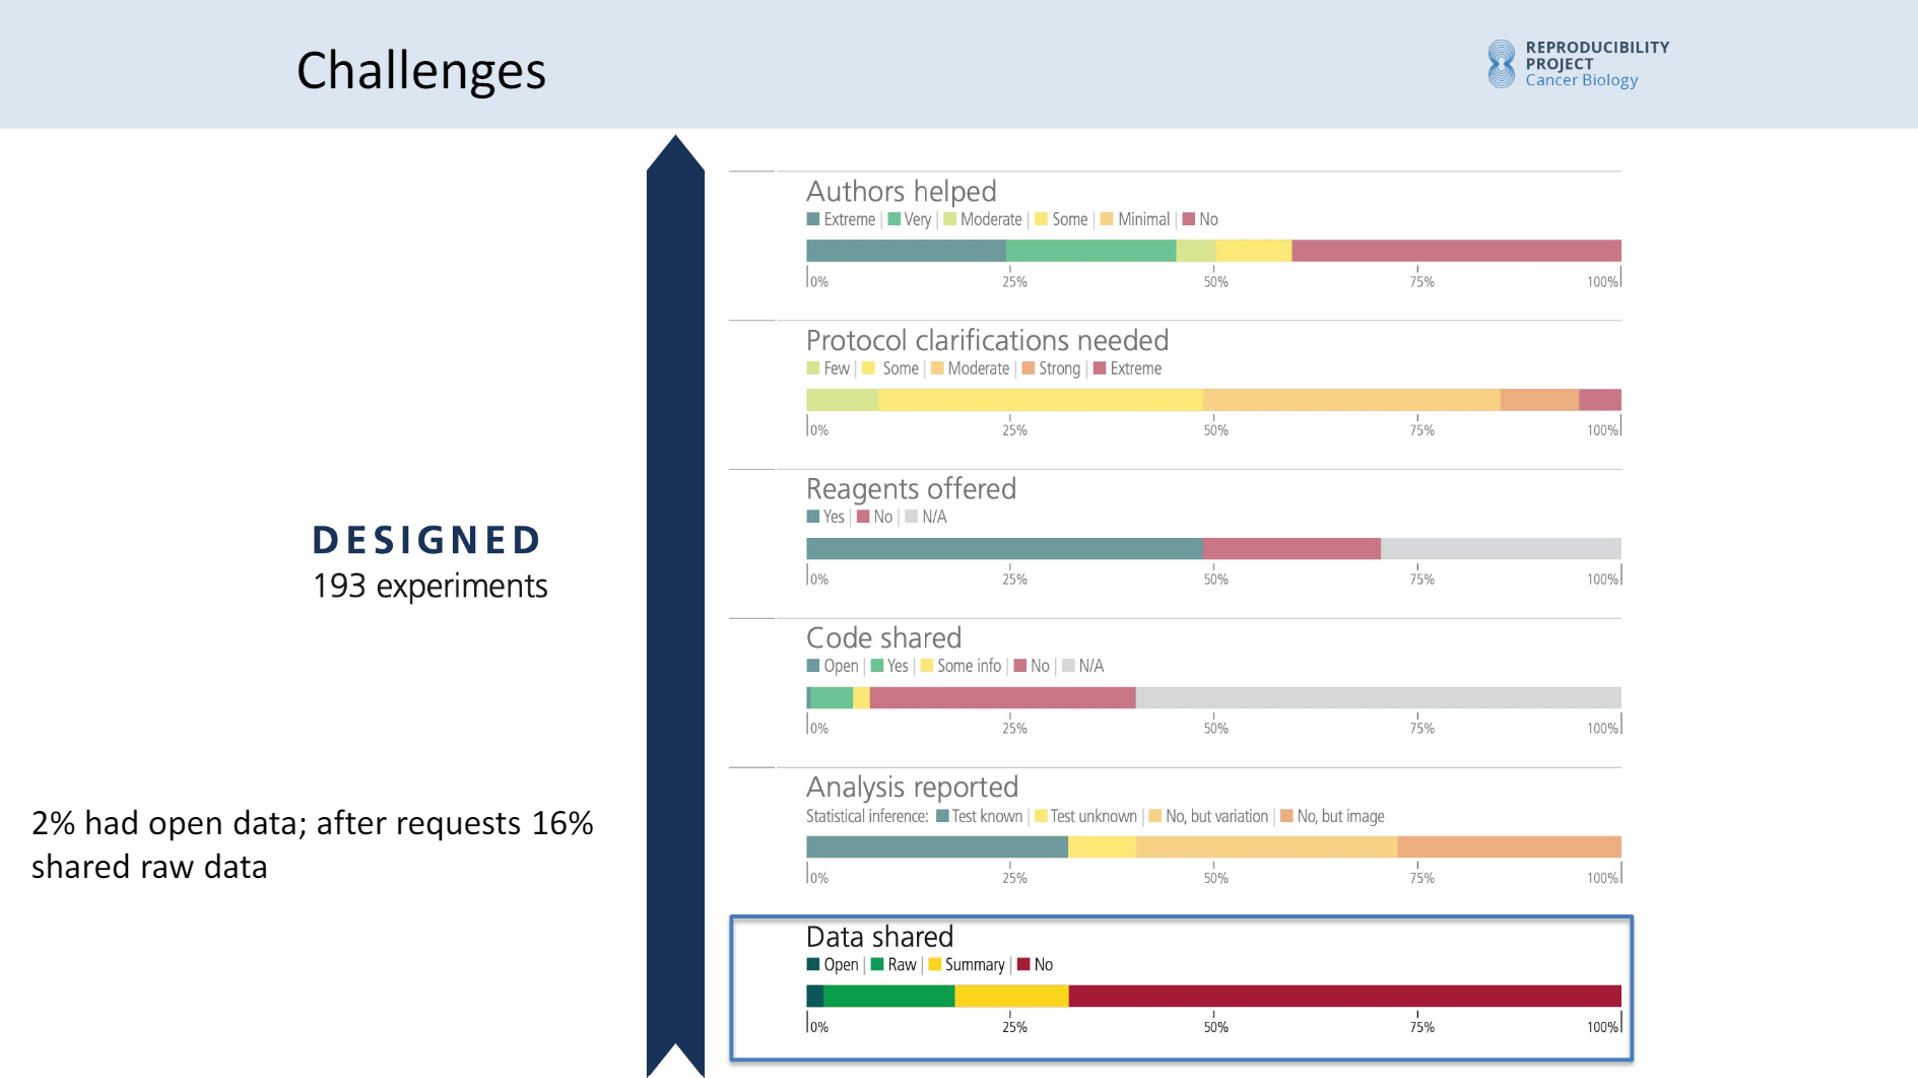
Data availability
ADD

Data sharing??

ADD

FAIR data

🔎 FINDABLE

Where is the data?
Data and/or metadata are deposited in a repository  •  Persistent identifier (e.g., DOI)

🔓 ACCESSIBLE

Can the data be accessed?
Open access or clearly described access conditions  •  Metadata remain accessible

🔗 INTEROPERABLE

Can it work with other data?
Standard metadata  •  Stable, open file formats

♻️ REUSABLE

Can others understand and use it?
Clear documentation (e.g., variable definitions)  •  Data usage licence

FAIR = Findable · Accessible · Interoperable · Reusable

4b. Code and documentation reproducibility


ADD

A. Portable and self-contained project

B. Automatize workflow

C. Create dynamic report

D. Version control

4b. Code and documentation reproducibility


ADD

A. Portable and self-contained project:
good project management

B. Automatize workflow:
stop clicking, start coding

C. Create dynamic report:
write reproducible manuscripts

D. Version control:
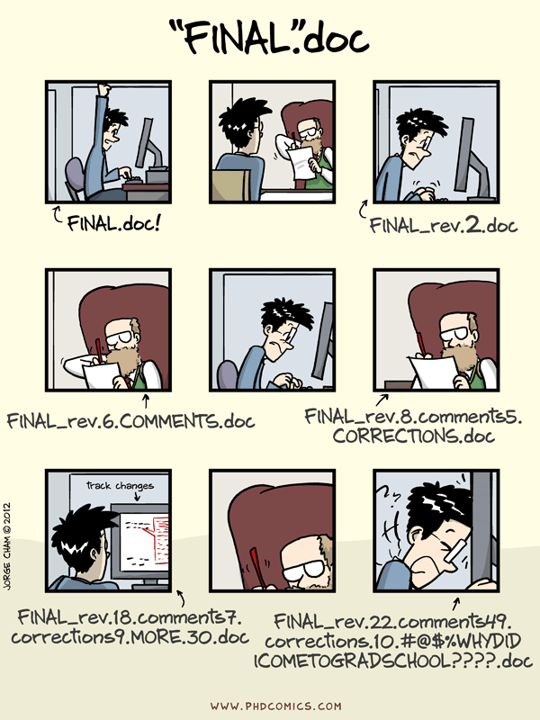
track your changes

A. Portable and self-contained project

R-Studio Projects

ADD

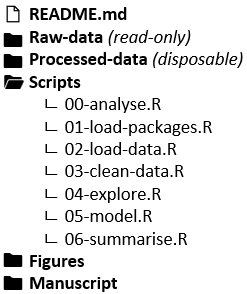
RStudio project .Rproj: raw data, script and documentation, and outputs in the same project directory

A. Portable and self-contained project

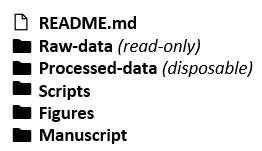
(Standardized) Folder structure
ADD

ADD

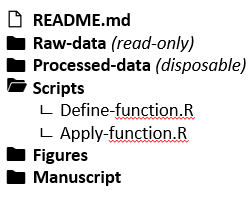
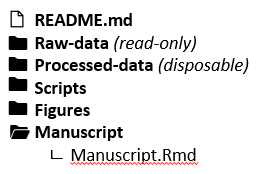
Standardized folder structure to increase clarity and reproducibility

B. Automatize workflow

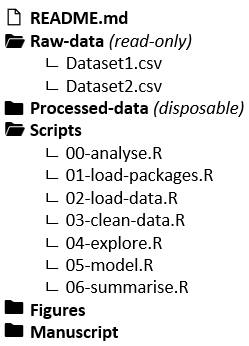
Separate your scripts

ADD

00-analyse.R

  • source(“01-load-packages.R”)
  • source(“02-load-data.R”)
  • source(“03-clean-data.R”)
  • source (“04-explore.R”)
  • source (“05-model.R”)
  • source (“06-summarize.R”)

ADD

B. Automatize workflow

Keep data machine readable
ADD

  • No color coding
  • No comments in numerical columns

B. Automatize workflow

Comment your code

  • Make sure you and others understand what the code is doing and why
    • More transparent workflows
    • Others can reuse and reproduce

C. Dynamic reports

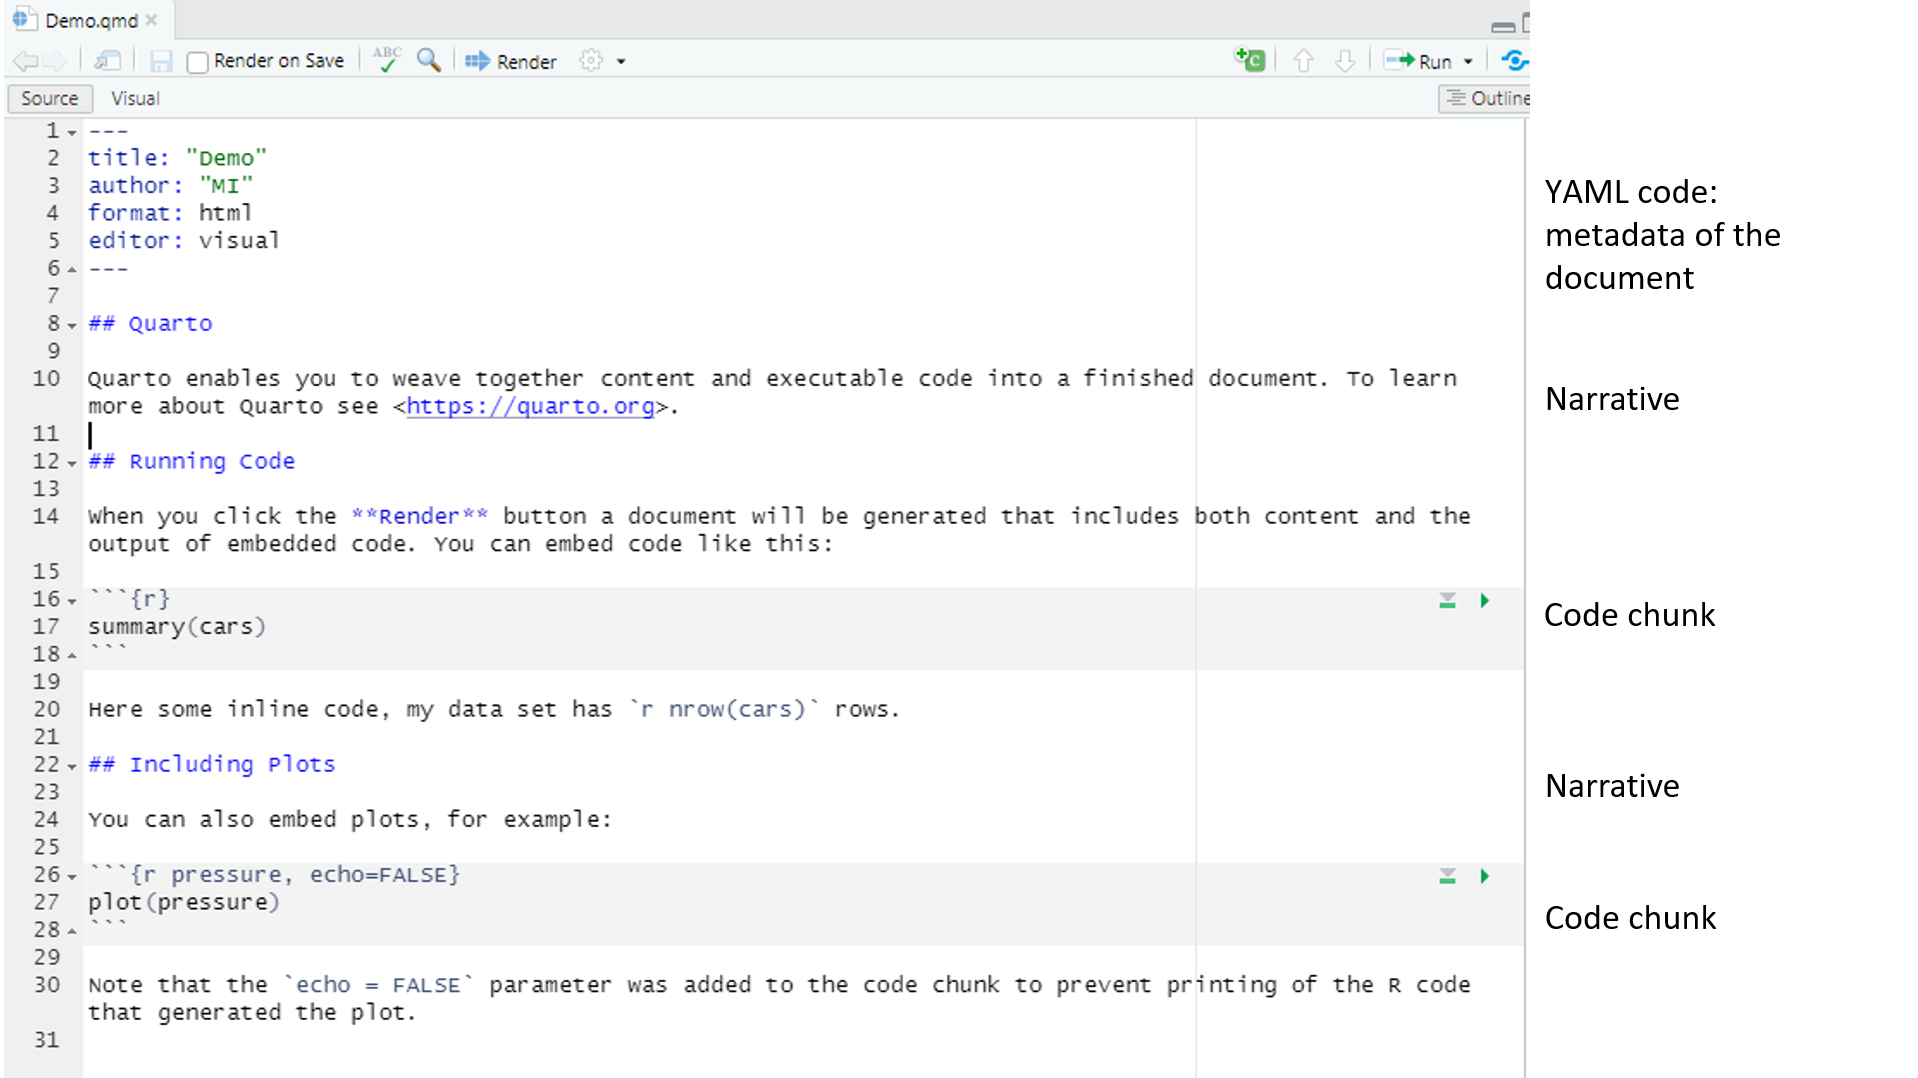
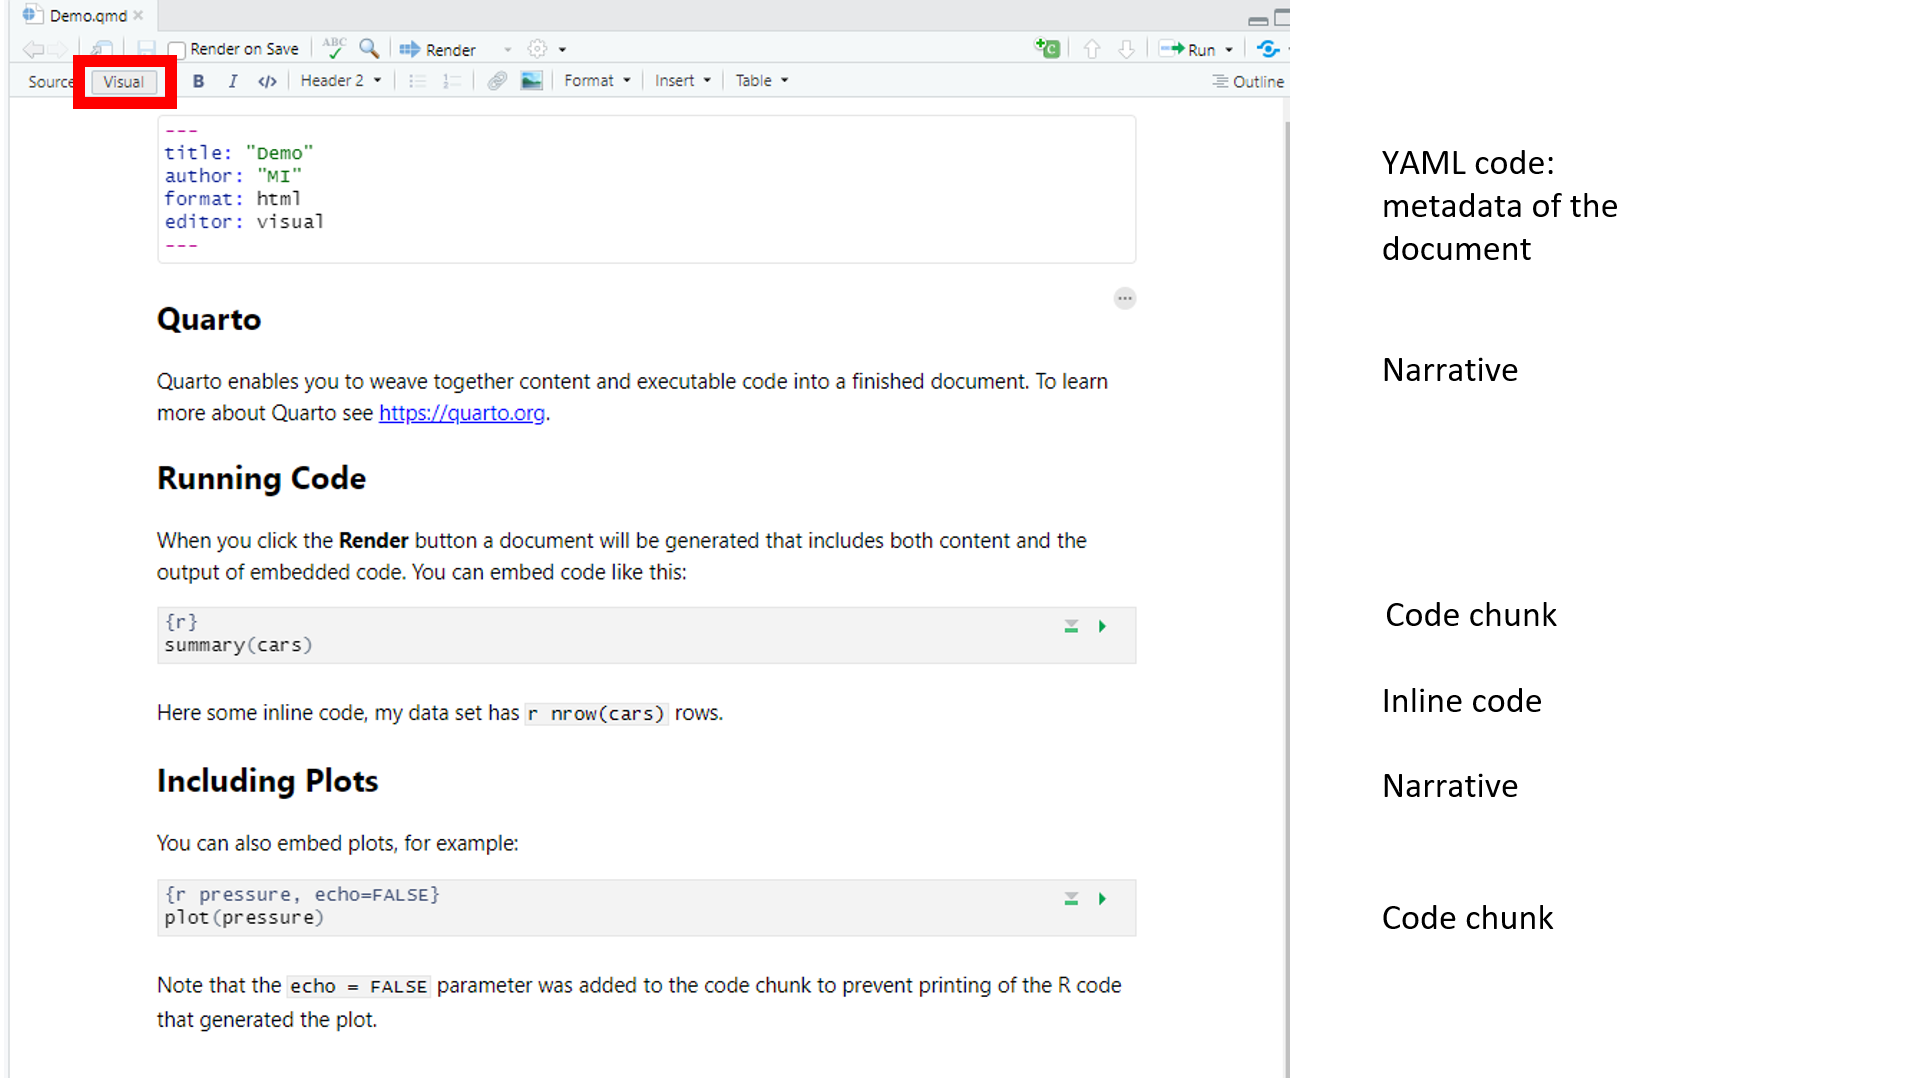
Literate programming (e.g., Quarto)

  • Code and narrative in one place
  • Rmarkdown/Quarto document:
    • Compiles into a .html, .pdf, .docx…
  • Output updates as soon as file changes and is recompiled

ADD

ADD

ADD

C. Dynamic reports

Example in RStudio source editor:
ADD

C. Dynamic reports

Example in RStudio visual editor:
ADD

D. Version control

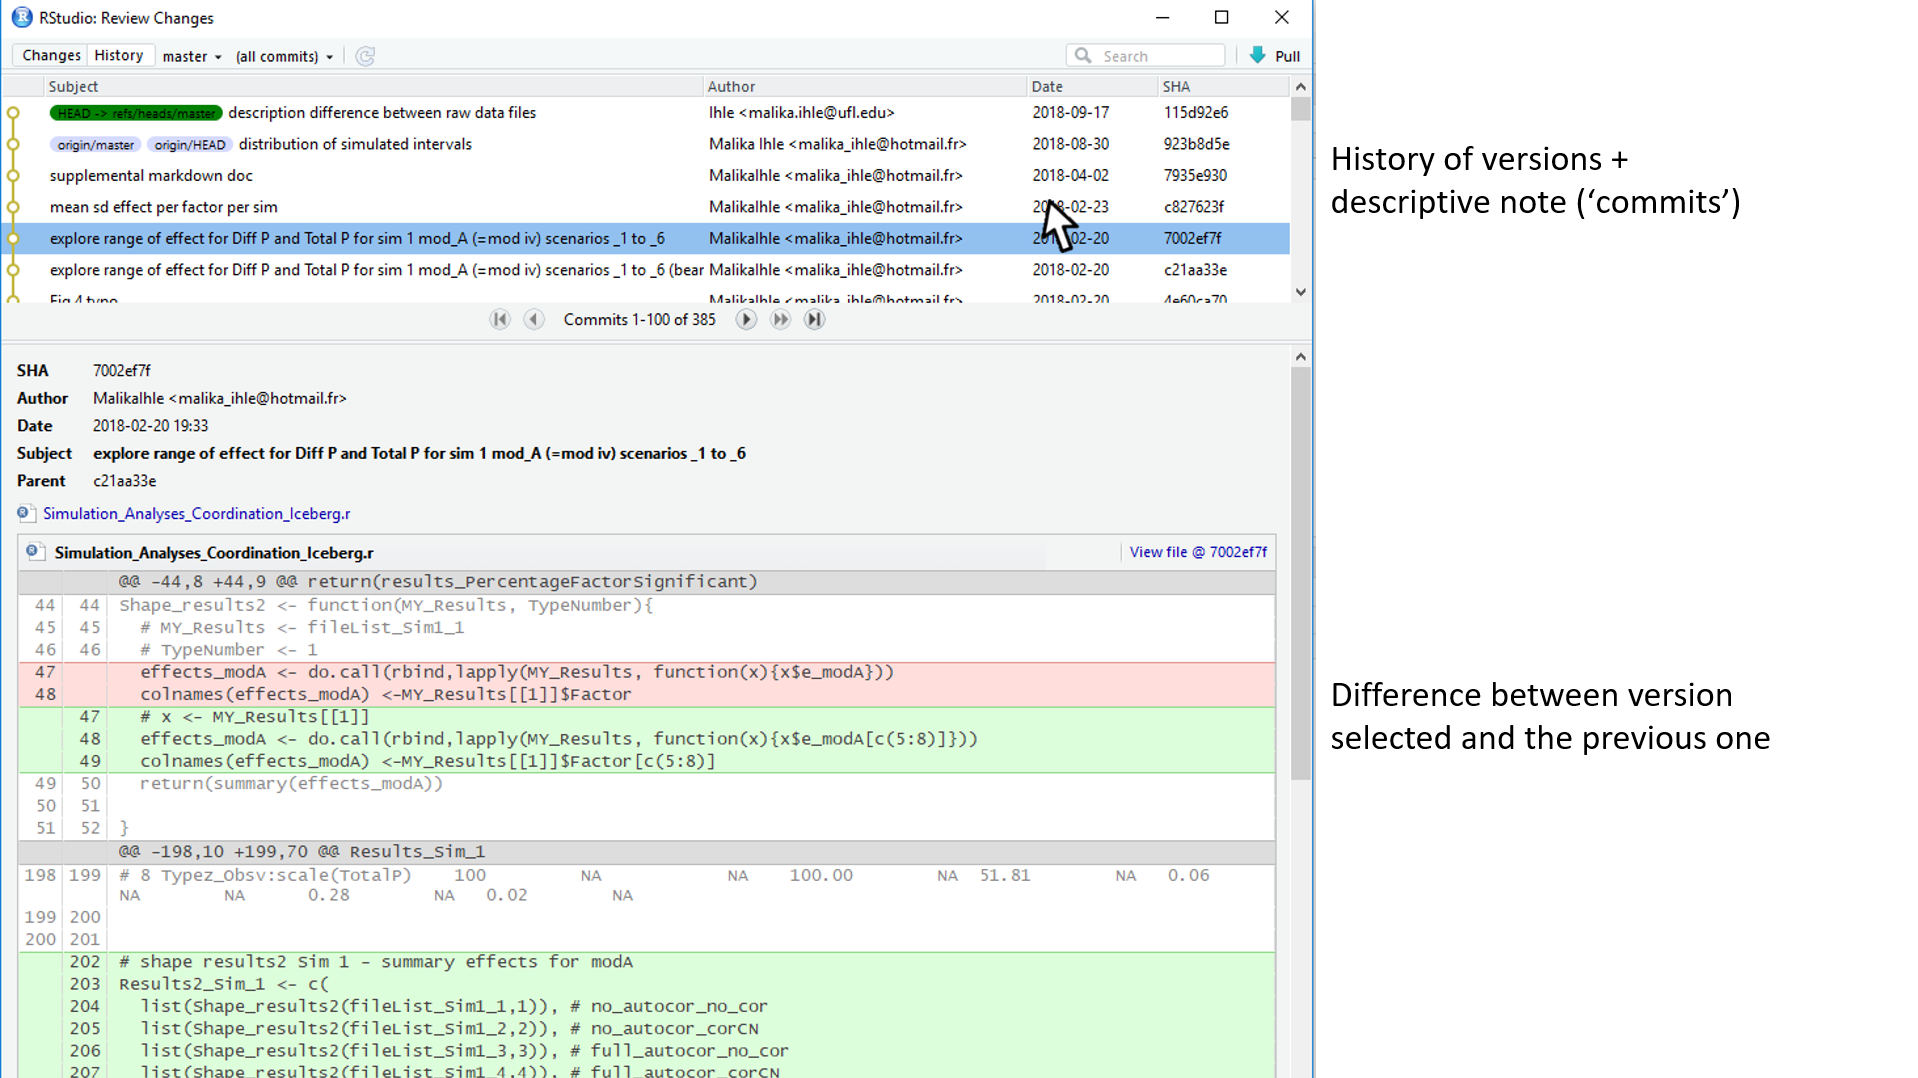
Git as a version control system

ADD

GitHub as software development host

ADD

ADD

D. Version control

Example of version controlled document in RStudio:
ADD

Recap tools: code and documentation reproducibility

ADD

ADD

ADD

ADD

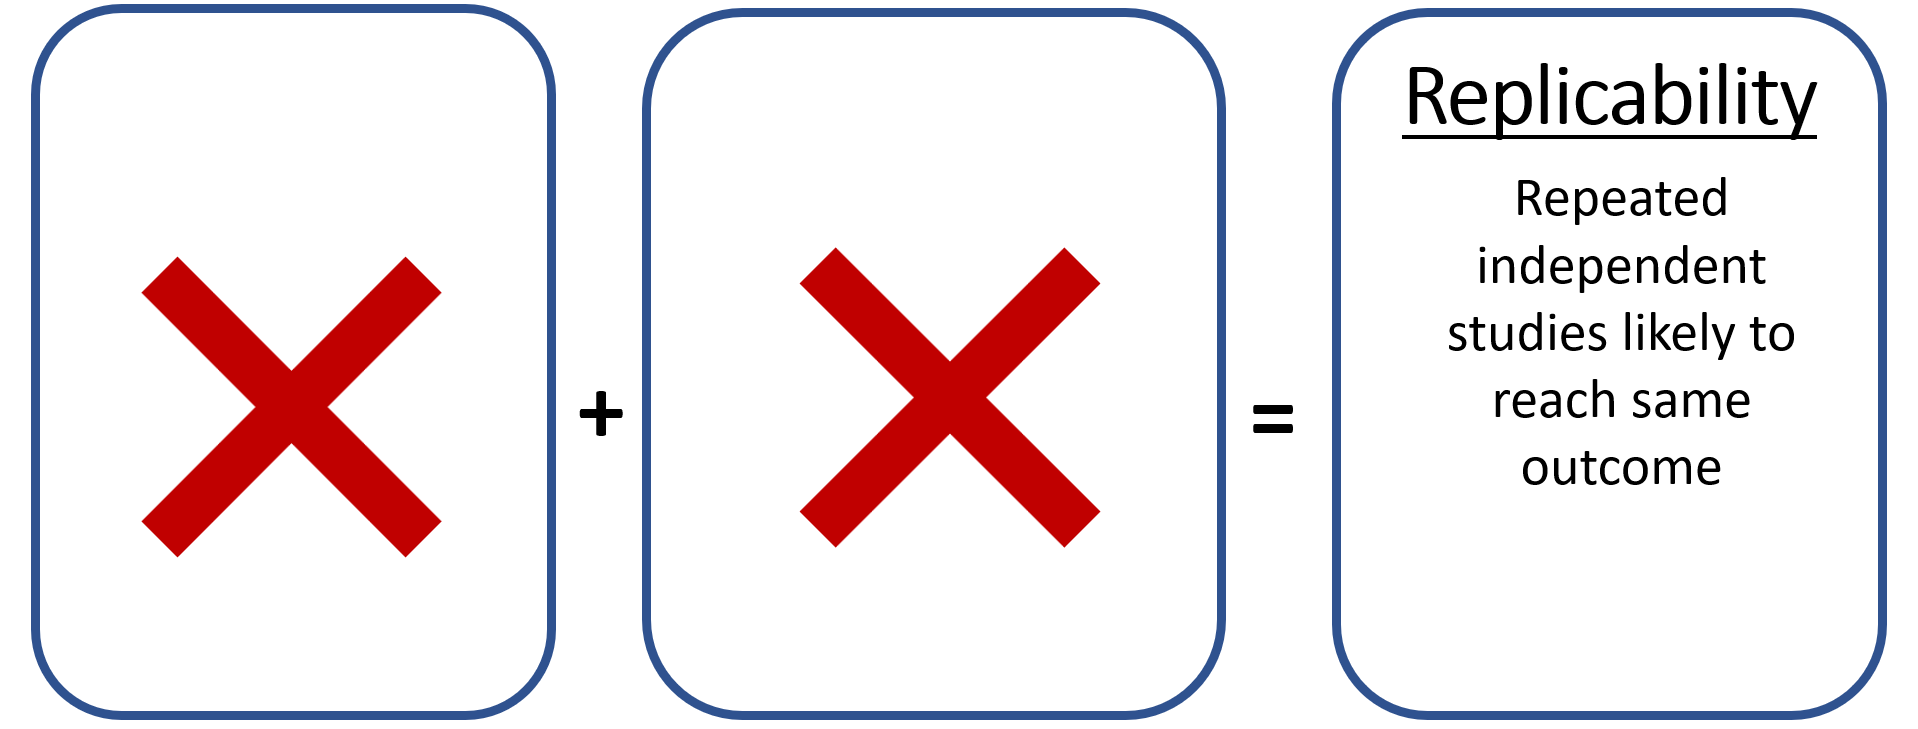
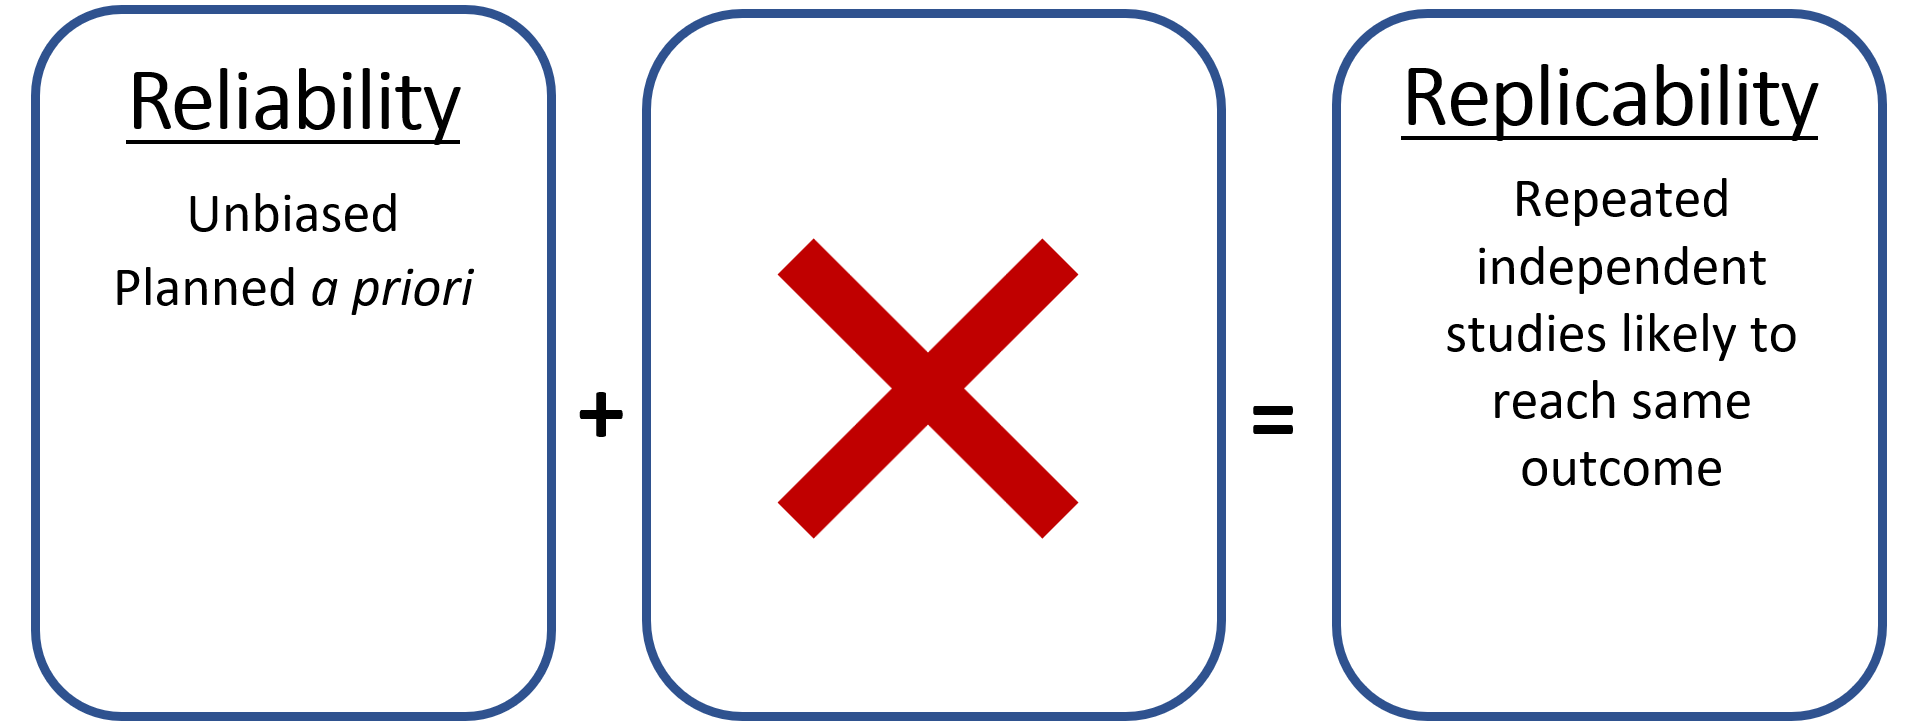
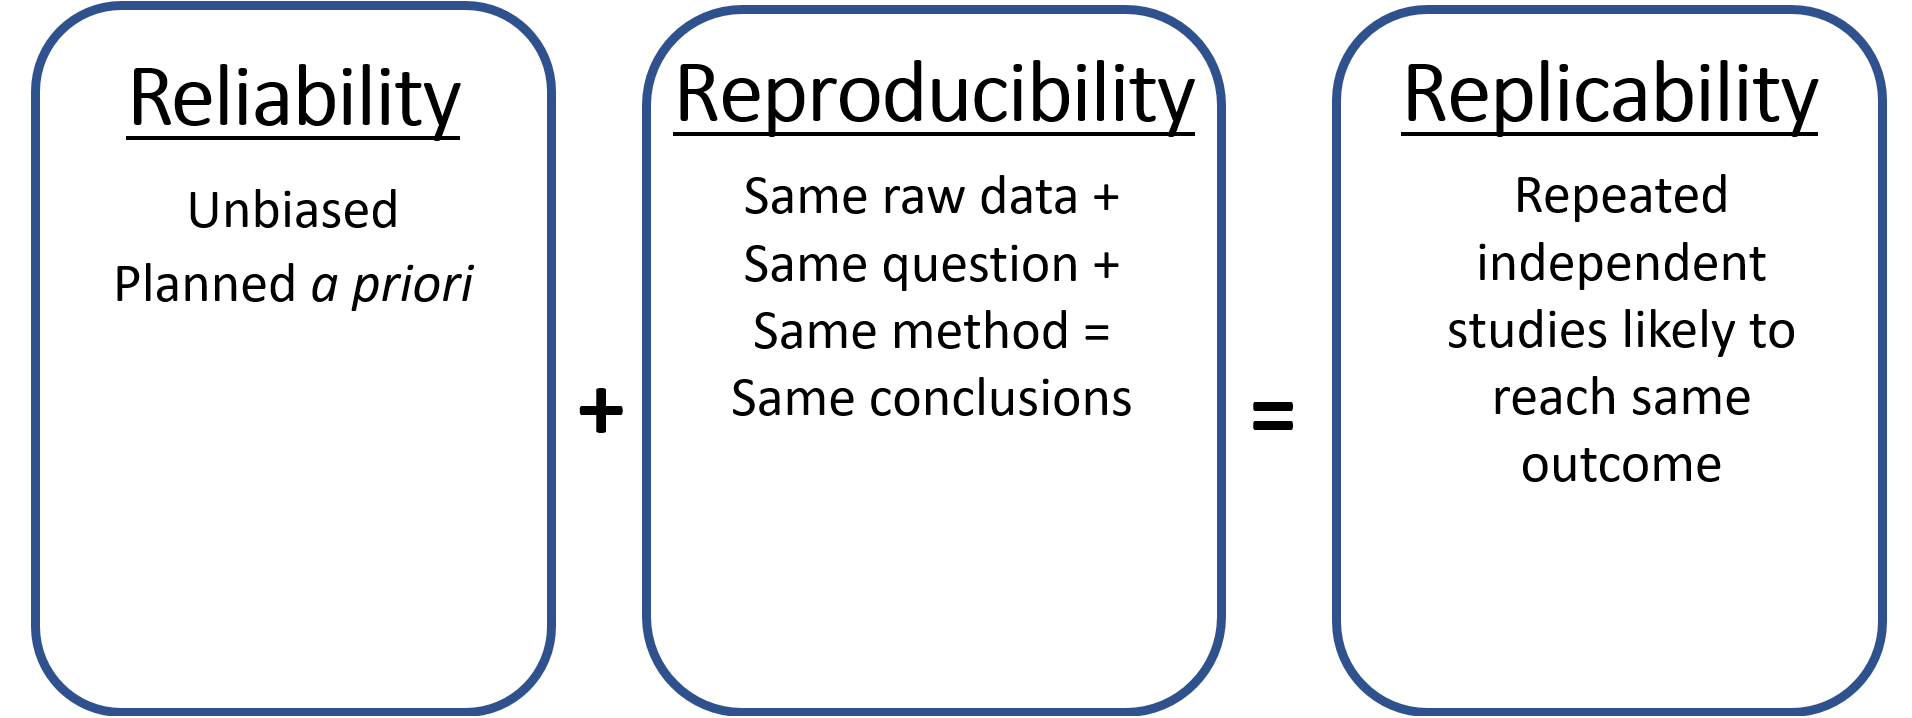
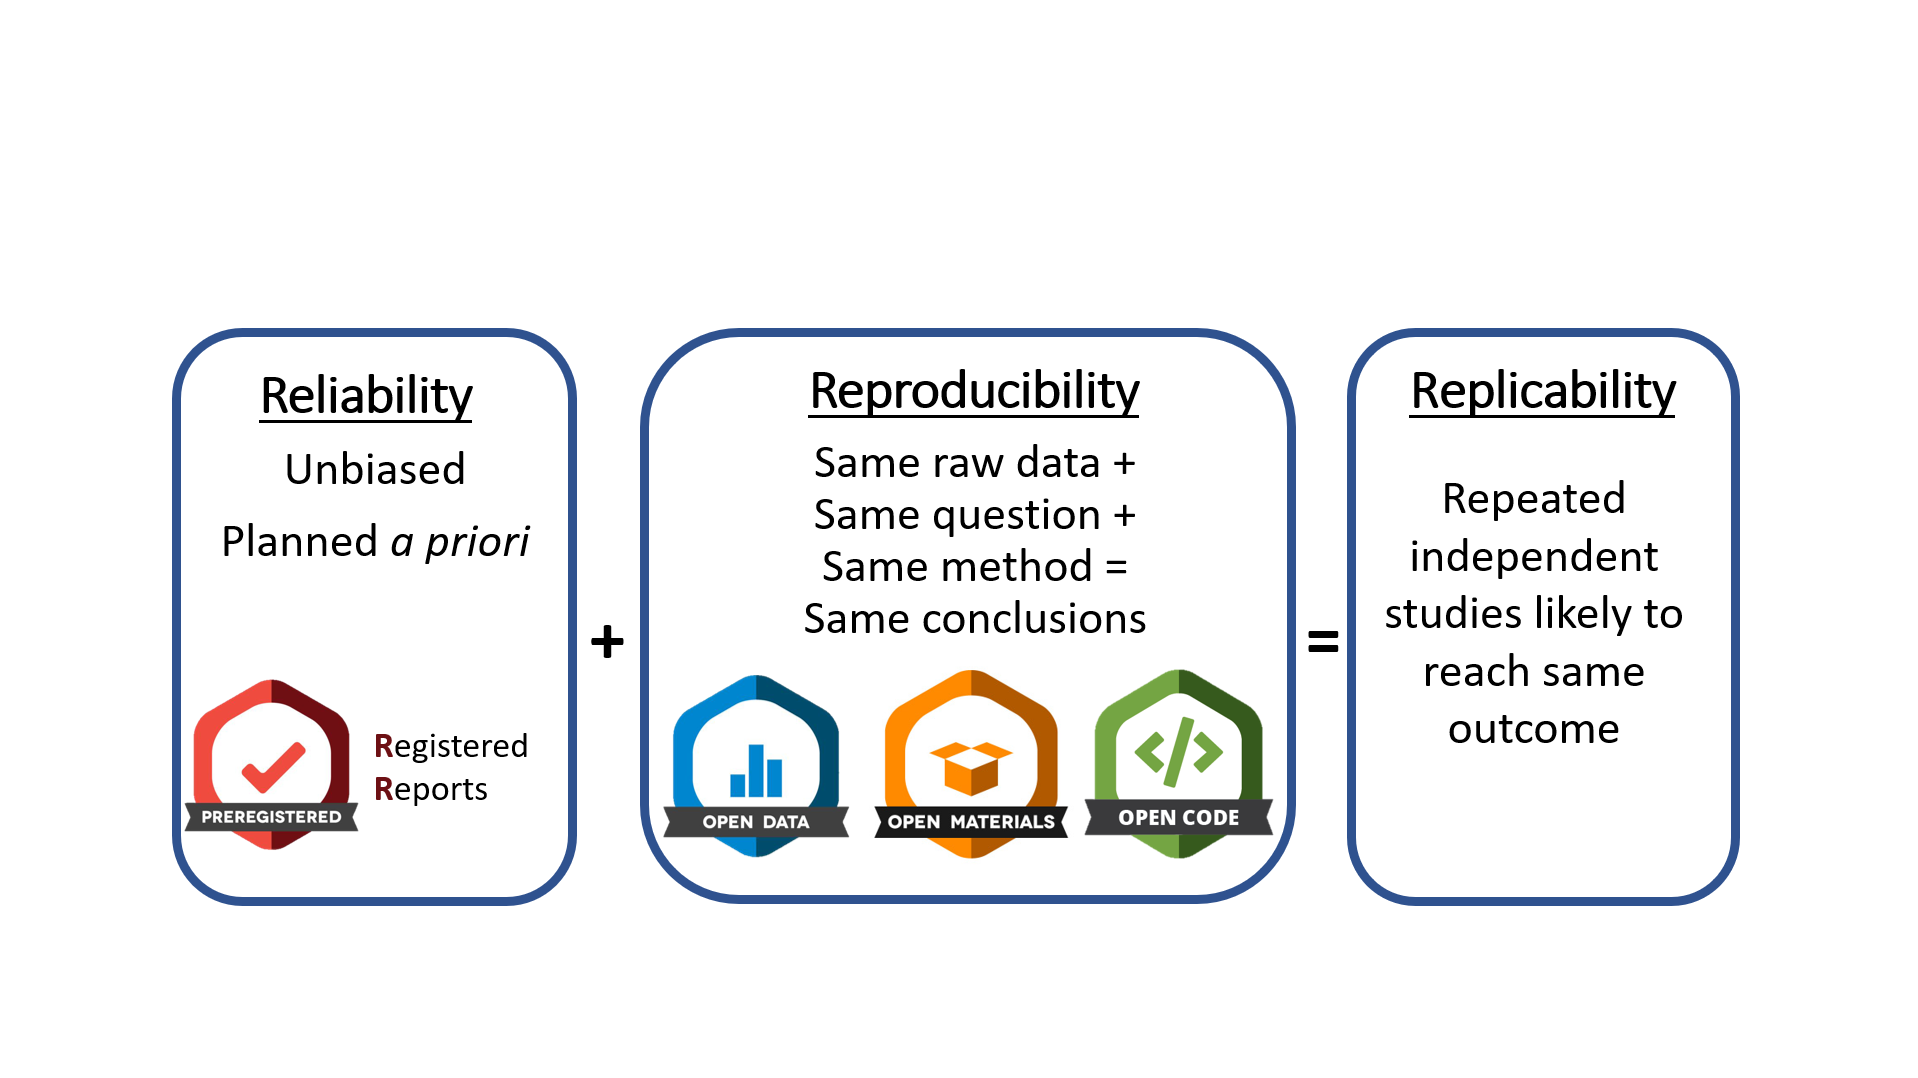
Recap: Reliability + Reproducibility = Replicability
ADD

Recap: Reliability + Reproducibility = Replicability
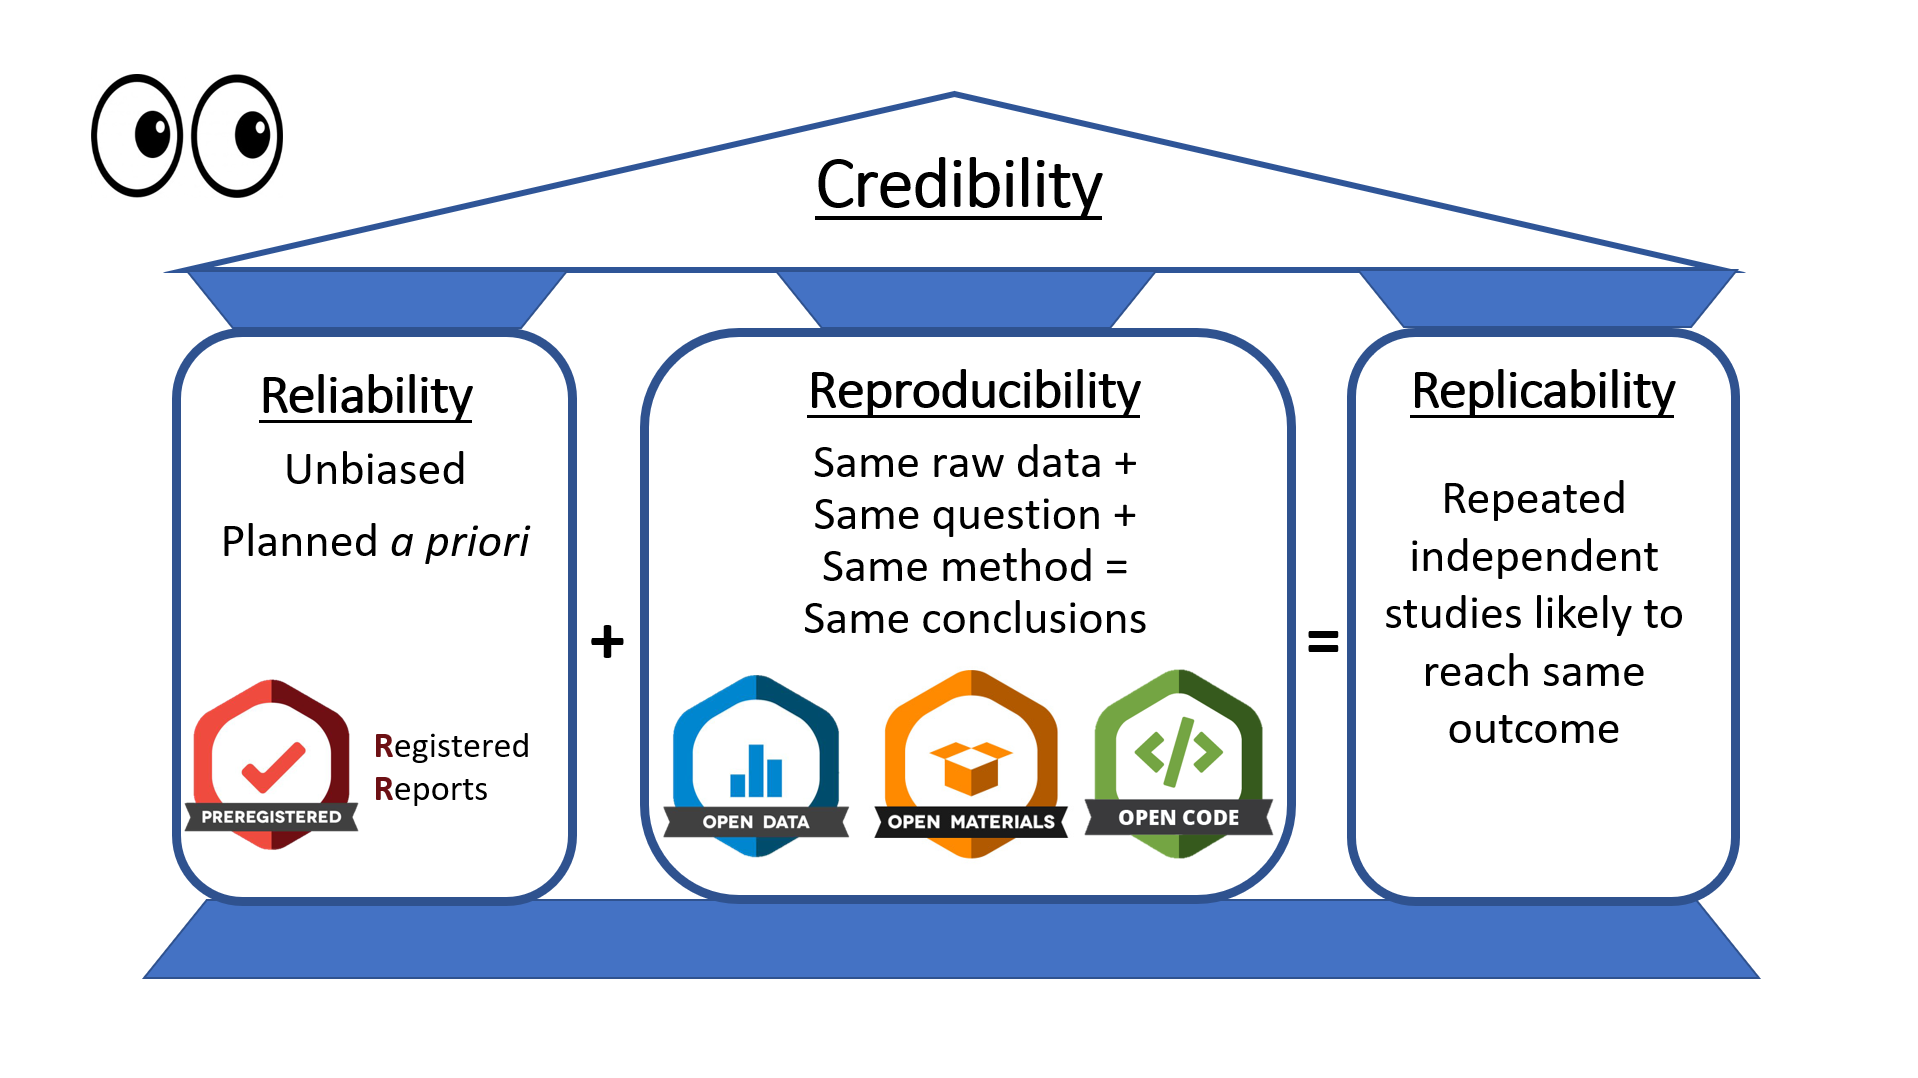
ADD

Recap: Obtaining replicability through open research practises

Ultimate goal: Perform repeated independent studies likely to reach the same outcome

The research practice of boosts .. because..
Preregistration Reliability limits hindsight and cognitive bias, a priori planning, limits false positives
Registered reports Reliability limits hindsight and cognitive bias, a priori planning, limits false positives, feedback by experts before conducting the study
Simulations Reliability strengthens confidence in planned statistical analysis
Data sharing Reproducibility making data available to others for reuse with FAIR principles
Code and documentation reproducibility Reproducibility portable projects (Rproj), automatization (README, folders), dynamic reporting (Quarto), version control (Git, GitHub

Quiz!

QR code here

Which of the following best reflects the FAIR principles for research data?

  1. Data should always be freely available, stored in the same file format, and understandable without documentation.

  2. Data should only be shared after publication and should be accessible without any authentication or restrictions.

  3. Data are FAIR when they can be opened and understood by the researcher who originally collected them.

  4. Data should be Findable, Accessible, Interoperable, and Reusable, supported by appropriate metadata, identifiers, standards, documentation, and usage licences.

What is the purpose of an RStudio Project?

  1. To provide a dedicated working environment that makes it easier to organize a project’s files and maintain a portable, self-contained workflow

  2. To automatically save all R objects, analyses, and outputs so that a project can be reproduced without sharing its code or data

  3. To ensure that all files used in an analysis are stored in a single folder, regardless of whether the analysis depends on files or resources elsewhere

  4. To replace version control by maintaining a complete history of changes to the project’s data, scripts, and outputs

Correct answer: a

What is the main purpose of literate programming with Quarto in an open science workflow?

  1. To keep the research narrative, analysis code, and results connected, making the research process more transparent and reproducible

  2. To automate statistical decisions so that researchers do not need to document their analytical choices

  3. To separate analysis code from the manuscript so that each can be independently reproduced

  4. To produce a polished manuscript without requiring researchers to share their underlying analysis code

Correct answer: a

What is the main purpose of version control in an open science workflow?

  1. To automatically correct errors in research code and ensure that analyses produce the expected results

  2. To track changes to project files over time, making it possible to review, compare, and recover earlier versions of the work

  3. To ensure that all researchers working on a project edit the same files simultaneously without creating different versions

  4. To automatically make research data and code publicly accessible as soon as they are created

Correct answer: b

Reflection activity


One-minute paper: Imagine you would have to explain the concept of computational reproducibility to a friend. Write down what you would say to them. (Tip: Include the three core elements and provide concrete strategies and tools for each of the elements)

Take-home message(s)

What are you taking away from today?

  • Plan before you carry out your study: Highly effective way to make research decisions a priori while reducing bias and increasing reliability of your work

  • Automate and document your research steps: Well-organized projects, machine-readable data, scripted and commented workflows, dynamic reports, and version control (Git) reduce errors and make your work reproducible and transparent

  • Make your research workflow transparent: Share data, code, documentation, and computational environments whenever possible to allows others (and your future self) to understand, reproduce, reuse and build on your work.

  • Reliability + reproducibility → greater replicability and credibility

Check in: Learning goals

After this session, learners will be able to:

  • Explain how common research practices and biases, such as p-hacking, HARKing, and researcher degrees of freedom, can threaten the credibility and replicability of research. ✅

  • Define key concepts related to credible and open research, including Open Research, preregistration, registered reports, FAIR data, and computational reproducibility.✅

  • Describe how open research practices, such as preregistration, registered reports, simulations, data sharing, and reproducible workflows, can help address threats to research credibility. ✅

  • Identify key components of a computationally reproducible workflow, including data, code and documentation, and the computational environment, and matching them to appropriate practices and tools. ✅

To conclude: Survey time!

QR code here

Which of the following concepts or skills do you feel most familiar with in relation to computational reproducibility? (Select all that apply)

  1. Creating and using RStudio projects

  2. Using a standardized folder structure for your projects

  3. Automatizing workflows through different scripts for different processing steps

  4. Commenting my code

  5. Using Quarto to combine code, text, figures etc. in one location

  6. Version control with Git

  7. None of the above

Discussion of survey results

Thanks!

TO DO Sarah

References

Christina Bergmann slides

https://docs.google.com/presentation/d/1bdICPzPOFs7V5aOZA2OdQgSAvgoB6WQweI21kVpk9Gg/edit?slide=id.p#slide=id.p

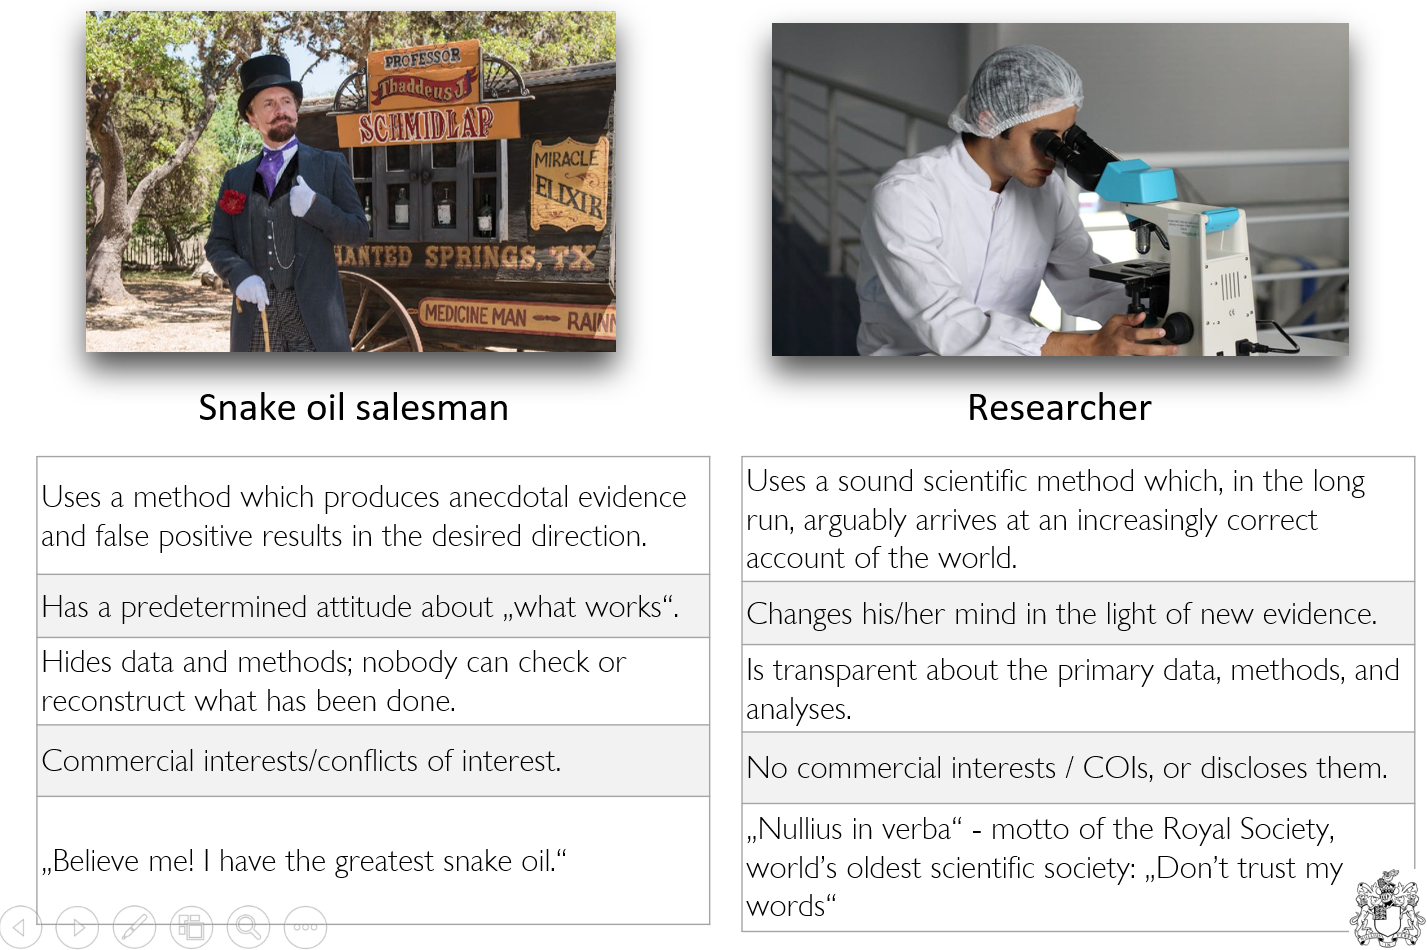
Snake oil salesman vs. researcher

snakesman analogy

Additional resources: OSC self-paced tutorials - FIX